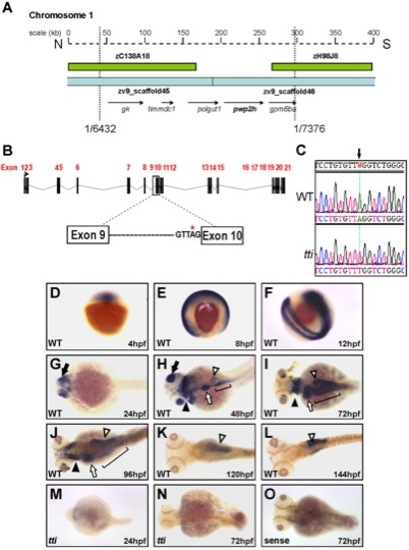
(A) Physical map of chromosome 1 in the region encompassing the ttis450 locus. Analysis of recombinants from 7376 meioses narrowed the genetic interval containing the mutation to a region flanked by 2 BACs (green boxes) and encompassed by 2 scaffolds zv945445 and zv945446 (blue bars) containing 5 genes (arrows). (B) Schematic representation of the pwp2h gene and the location of the sequence variation in intron 9. (C) The nucleotide sequence of pwp2h cDNA from ttis450 larvae contains an A→T transversion. Wholemount in situ hybridization (WISH) reveals the pwp2h mRNA expression pattern from 4–144 hpf in WT larvae (D–L). pwp2h expression is ubiquitous from 4–12 hpf (D–F), restricted to the retina at 24 hpf (G; black arrow) and encompasses the pharyngeal cartilages (black arrowhead), liver (white arrow), intestine (bracket) and pancreas (white arrowhead) at 48 hpf (H), 72 hpf (I) and 96 hpf (J). From 120–144 hpf pwp2h expression is restricted to the pancreas (K–L; white arrowhead). pwp2h expression is barely detectable at 24 hpf (M) and 72 hpf (N) in ttis450 larvae. Staining is absent in the sense control at 72 hpf (O) and at all other time points (data not shown).
|
