
Fig. S5
- ID
- ZDB-FIG-130411-4
- Publication
- Boglev et al., 2013 - Autophagy induction is a tor- and tp53-independent cell survival response in a zebrafish model of disrupted ribosome biogenesis
- Other Figures
- All Figure Page
- Back to All Figure Page
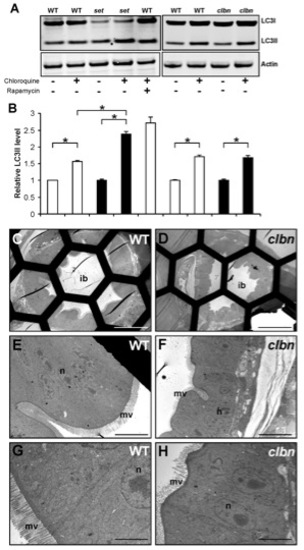
Up-regulated autophagy is not a shared feature of all zebrafish intestinal mutants. (A) Western blot analysis of LC3 in protein extracts of WT, setebos (sets453) and caliban (clbns846) larvae. Actin was used as a loading control. (B) The levels of LC3II were quantitated by densitometric analysis of three independent Western blots. Chloroquine-treated sets453 larvae at 96 hpf contain significantly higher LC3II levels compared to their chloroquine-treated WT siblings; meanwhile, LC3II levels are similar in chloroquine-treated sets453 larvae and WT larvae treated with rapamycin and chloroquine. There are no significant differences between LC3II levels in clbns846 larvae and their WT siblings at 120 hpf, in the presence and absence of chloroquine. Data are represented as mean +/ SD (n = 3), *p<0.05. (C–H) Transmission electron micrographs of transverse sections of WT (C, E, G) and clbns846 larvae (D, F, H) through the intestinal bulb region at 120 hpf. There are negligible numbers of autophagosomes/autolysosomes in the IECs of WT and clbns846 larvae. Scale bars = 50 μm (C, D); 10 μm (E, F); 5 μm (G–H). ib, intestinal bulb; n, nucleus; m, mitochondria; mv, microvilli. |