
Fig. 2
- ID
- ZDB-FIG-130206-5
- Publication
- Li et al., 2012 - Reciprocal Regulation between Resting Microglial Dynamics and Neuronal Activity In Vivo
- Other Figures
- All Figure Page
- Back to All Figure Page
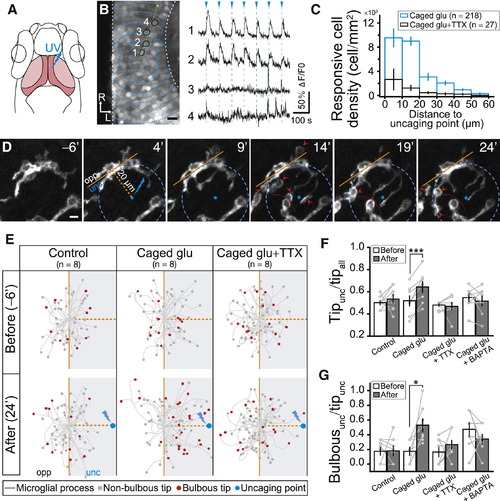
Glutamate Uncaging-Induced Local Increase of Neuronal Activity Attracts Resting Microglial Processes and Induces Bulbous Ending Formation(A) Schematic of glutamate uncaging in optic tectum of zebrafish larvae. UV uncaging pulse (blue) is delivered to 1 μm diameter region in optic tectum soma layer (dark pink). Neuropil of the optic tectum, light pink. Rostral is to up of image.(B) OGB-AM labeled optical section (left) and glutamate uncaging-induced Ca2+ responses of four example tectal neurons (black circles along the dashed yellow arrow) (right). Blue arrowheads and dashed lines indicate timing of glutamate uncaging (1.5 min interval, 65-ms duration).(C) Responsive cell density in different ring areas depicted in (B) (dashed blue circles) around the uncaging point (blue spot) under different conditions. Data summarized from eight and six individual experiments with bath application of caged glutamate (“Caged glu”, blue) or caged glutamate + TTX (“Caged glu + TTX”, black), respectively. Total neuron number exhibiting Ca2+ activity in response to glutamate uncaging in brackets.(D) Time-lapse images of microglial process movement after focal glutamate uncaging. Boundary of two microglia, dashed magenta line. Uncaging performed repetitively at 0, 5, 10, 15, and 20 min; images taken from 6 min before the uncaging with interval of 5 min. Microglia divided into uncaging (unc) and opposite sides (opp) by brown lines. Bulbous endings, red arrowheads.(E) Spatial distribution of stick-like (gray dot) and bulbous endings (red dot) 6 min before (top) and 24 min after (bottom) beginning of uncaging when larvae were incubated with normal solution (left), caged glutamate (middle), and caged glutamate + TTX (right). Data from eight microglia (each from different larvae).(F and G) Ratios of process tip number at uncaging side to all area (Tipunc/tipall, F) and bulbous tip number to all tip number at uncaging side (Bulbousunc/tipunc, G) 6 min before (open bar) and 24 min after (filled bar) the beginning of uncaging under different conditions. Data from same cells are connected by a line.Scale bars: 10 μm in (B) and 5 μm in (D). p < 0.05; p < 0.001. Error bars represent ± SEM.See also Figure S2. |
Reprinted from Developmental Cell, 23(6), Li, Y., Du, X.F., Liu, C.S., Wen, Z.L., and Du, J.L., Reciprocal Regulation between Resting Microglial Dynamics and Neuronal Activity In Vivo, 1189-1202, Copyright (2012) with permission from Elsevier. Full text @ Dev. Cell