
Fig. S4
- ID
- ZDB-FIG-130205-21
- Publication
- Li et al., 2012 - Reciprocal Regulation between Resting Microglial Dynamics and Neuronal Activity In Vivo
- Other Figures
- All Figure Page
- Back to All Figure Page
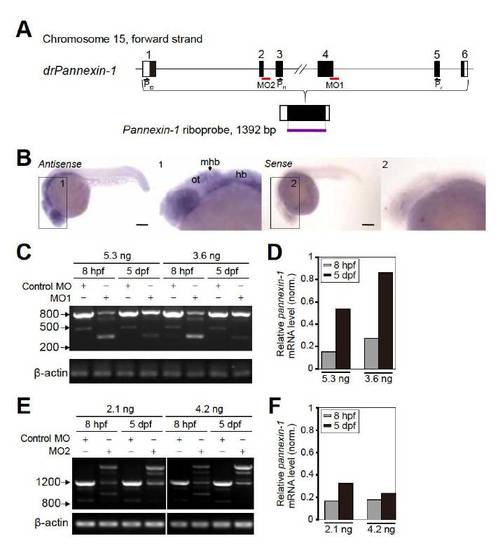
Expression Pattern of Pannexin-1 in Larval Zebrafish and the Knockdown Efficiency of Pannexin-1 Splice Morpholinos (A) Schematic of zebrafish pannexin-1 loci, including the exon (numbered boxed regions) and intron structures. Within each exon, nucleotides contributing to the presumed protein sequence are shaded. The entire coding region of pannexin-1 was used to generate digoxygenin-labeled sense and antisense riboprobes. Positions of splice sites targeted by pannexin-1 splice morpholinos (MO1 and MO2, red line) and RT-PCR primers (Pf1, Pf2 and Pr) are shown. (B) Lateral view of whole-mount in situ hybridization of pannexin-1 in zebrafish embryos at 1 dpf, showing widely expression of pannexin-1 in larval zebrafish brain, including the optic tectum. Sense control probe shows low levels of background staining. The brain region was enlarged in the inset 1 and 2 for antisense- and sense-stained embryo, respectively. The images were obtained from the same embryos shown in Figure 4A. ot, optic tectum; hb, hindbrain; mhb, midbrain-hindbrain boundary. Scale: 150 μm. (C-F) Knockdown efficiency of pannexin-1 MO1 (C and D) and MO2 (E and F). RT-PCR analysis of the pannexin-1 mRNA region flanking the targeted splice site was performed in control and pannexin-1 MO-injected embryos at 8 hpf and 5 dpf. The mRNA regions flanking MO1- (C) and MO2-targeted splice sites (E) were amplified by primer pair of Pf1/Pr and Pf2/Pr, respectively. The amount of wild-type RT-PCR products (830 bp band in C for MO1 and 1233 bp band in E for MO2) were reduced in pannexin-1 morphants compared with control embryos, and either shorter or longer splice-mutant amplification products were observed in pannexin-1 morphants. The knockdown efficiency exhibits dose-dependency for both MO1 (D) and MO2 (F). The amounts of mRNA in pannexin-1 morphants were normalized to those in control embryos. β-actin was used as an internal control. |
Reprinted from Developmental Cell, 23(6), Li, Y., Du, X.F., Liu, C.S., Wen, Z.L., and Du, J.L., Reciprocal Regulation between Resting Microglial Dynamics and Neuronal Activity In Vivo, 1189-1202, Copyright (2012) with permission from Elsevier. Full text @ Dev. Cell