
Fig. 4
- ID
- ZDB-FIG-130206-3
- Publication
- Li et al., 2012 - Reciprocal Regulation between Resting Microglial Dynamics and Neuronal Activity In Vivo
- Other Figures
- All Figure Page
- Back to All Figure Page
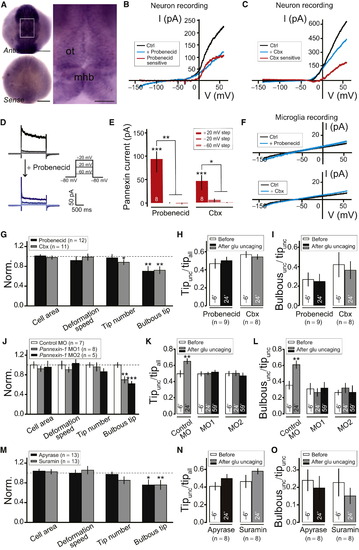
Pannexin-1 Hemichannels on Neurons and ATP/P2 Receptor Signaling Are Required for Neuronal Activity-Induced Steering and Bulbous Ending Formation of Microglial Processes(A) Dorsal view of whole-mount in situ hybridization of pannexin-1 in zebrafish embryos at 1 dpf. ot, optic tectum; mhb, midbrain-hindbrain boundary. Scale bar represents 150 µm (A); 50 µm (inset).(B and C) I-V plots of tectal neurons before (black) and after local puffing of 5 mM Probenecid (B, blue) or 500 μM Carbenoxolone (Cbx; blue in C). Red traces indicate Probenecid-sensitive (B) or Cbx-sensitive (C) currents. Voltage ramp with 500-ms duration from 140 mV to +60 mV was applied to obtain the I-V plot; cells held at 80 mV.(D) Depolarization voltage step-induced current before (top) and after (bottom) local puffing of 5 mM Probenecid against the soma of recorded tectal neuron.(E) Averaged amplitude of Probenecid- and Cbx-sensitive voltage step-evoked pannexin currents. Number of tectal neurons examined in larvae between 4–6 dpf on bar. In (D) and (E), cell was held at 80 mV and depolarized to +20 mV (dark color), 20 mV (middle color), or 60mV (light color) for 2 s.(F) I-V plots of microglia before (black) and after (blue) local puffing of 5 mM Probenecid (top) or 500 μM Cbx (bottom). Microglia recorded from Tg(Apo-E:eGFP) larvae.(G) Summary of effects of Probenecid (2.5 mM) or Cbx (50 μM) on overall morphology of resting microglia. All data normalized to control.(H and I) Tipunc/tipall (H) and Bulbousunc/tipunc (I) 6 min before, and 24 min after beginning of glutamate uncaging, when larvae were incubated in Probenecid (2.5 mM) or Cbx (50 μM).(J) Summary of effects of pannexin-1 MO1 and MO2 on overall morphology of resting microglia. All data normalized to control.(K and L) Tipunc/tipall (K) and Bulbousunc/tipunc (L) 6 min before, 24 min, and 59 min after the beginning of glutamate uncaging in larvae injected with control MO, pannexin-1 MO1 or MO2. Same data set as (J) was used.(M) Summary of effects of Apyrase (5 U/ml) or Suramin (100 μM) on overall morphology of resting microglia. All data normalized to control.(N and O) Tipunc/tipall (N) and Bulbousunc/tipunc (O) 6 min before and 24 min after beginning of glutamate uncaging, when larvae were incubated in Apyrase (5 U/ml) and Suramin (100 μM). p < 0.05; p < 0.01; p < 0.001. Error bars, ± SEM.See also Figure S4. |
| Gene: | |
|---|---|
| Fish: | |
| Anatomical Terms: | |
| Stage: | Prim-5 |
Reprinted from Developmental Cell, 23(6), Li, Y., Du, X.F., Liu, C.S., Wen, Z.L., and Du, J.L., Reciprocal Regulation between Resting Microglial Dynamics and Neuronal Activity In Vivo, 1189-1202, Copyright (2012) with permission from Elsevier. Full text @ Dev. Cell