
Fig. 8
- ID
- ZDB-FIG-120824-20
- Publication
- Chen et al., 2012 - Haemodynamics-driven developmental pruning of brain vasculature in zebrafish
- Other Figures
- All Figure Page
- Back to All Figure Page
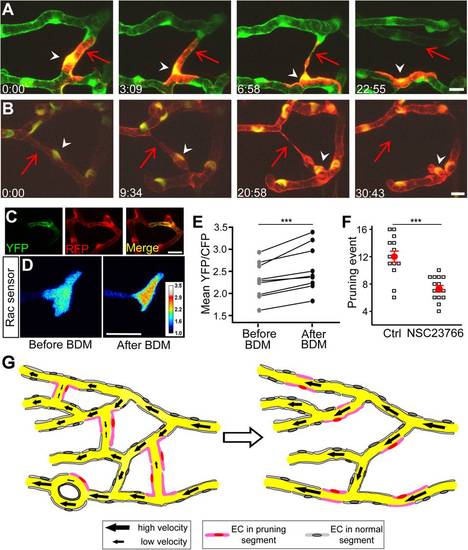
Vessel pruning is associated with endothelial cell migration and involves Rac1 activity. (A and B) Representative of tracing of single EC (A) or EC nuclei (B) showing that ECs (arrowheads) in pruned segments (arrows) migrated to adjacent unpruned segments during vessel pruning. The mCherry was mosaically expressed in single ECs of Tg(kdrl:eGFP) embryos (A), and Tg(kdrl:RFP,fli1:nEGFP) larvae were used to trace single EC nuclei (B, yellow). The arrows mark pruned vessel segments, and the arrowheads mark a migrating EC (A) or EC nucleus (B). Scales, 10 µm in (A and B). (C) Mosaic expression of the Raichu Rac1 FRET sensor in vascular endothelial cells of Tg(kdrl:RFP) zebrafish brain. YFP and RFP signals indicate FRET sensor and vascular endothelial cells, respectively. (D) Representative images showing the emission ratio (YFP/CFP) of the same EC expressing Rac1 FRET sensor before and after blood flow reduction induced by 30-min BDM treatment. The intensity of Rac1 FRET signal is color-coded. (E) Summary of data. Data obtained from the same EC are connected by a line. (F) Effect of NSC23766 treatment on the occurrence of vessel pruning per larva. NSC23766 was applied from 2 to 3 dpf and the pruning event was examined between 2 and 3 dpf. Each open symbol represents data obtained from one larva, and the red ones represent the mean values. (G) Working model. In the primitive vasculature (left), some vessel segments exhibit low and unstable blood flow, and ECs located at these segments (pink) undergo lateral migration, leading to vessel pruning. This pruning consequently results in the formation of a simplified vasculature with reduced numbers of internal vessel loop and segment Strahler order (right). Scales, 20 μm in (C) and (D). *** p<0.001 (paired Student′s t test in E and unpaired Student′s t test in F). Error bars, ± SEM. |