
Fig. S9
- ID
- ZDB-FIG-120824-12
- Publication
- Chen et al., 2012 - Haemodynamics-driven developmental pruning of brain vasculature in zebrafish
- Other Figures
- All Figure Page
- Back to All Figure Page
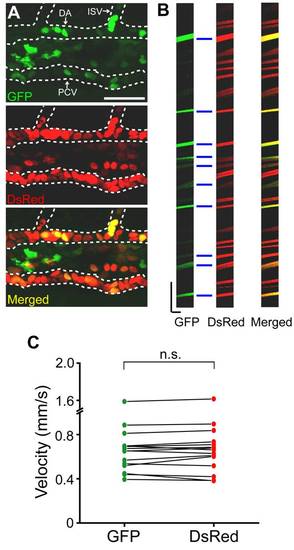
Verification of the measurement of blood cell velocity. (A) Projected images of the trunk vasculature in a double transgenic zebrafish Tg(PU.1:gal4-uas-GFP,gata1:DsRed) larva at 4 dpf. Dashed lines delineate the dorsal aorta (DA), posterior cardinal vein (PCV), and intersegmental vessel (ISV). Top, GFP signal; middle, DsRed signal; bottom, merged signal. Scale, 40 µm. (B) Kymographs of blood cells in 4-dpf midbrain vessels by measuring GFP (left) and DsRed (middle) signals. Right, merged. Blue lines mark blood cells expressing both GFP and DsRed. Scales, 5.43 μm (x-axis), 79 ms (y-axis). (C) Comparison of blood flow velocity measured with GFP- or DsRed-expressing blood cells in midbrain vessels. Each point represents the mean velocity of blood flow in one vessel segment, and the data from the same vessel are connected by a line. The mean velocity of each segment was averaged from 100±16 blood cells. The data were obtained from 15 segments in 2 larvae. n.s., no significance (paired Student′s t test). Error bars, ± SEM. |