
Fig. 5
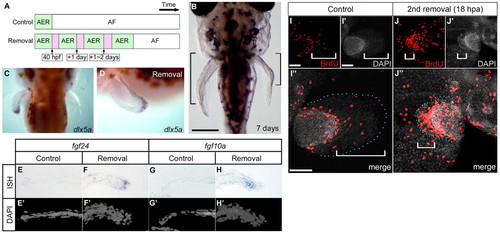
Repeated AF removal caused prolonged developmental gene expression and excessive elongation of the endoskeletal region. (A) Experimental strategy for continuous AER presence. Bars indicate pectoral fin development time scale (control and removal sides of the fin). (B) A sample (7 days post-fertilization) after AF removal was performed three times on the left side of the pectoral fin bud. Black brackets indicate the endoskeletal region. Scale bar: 200 μm. (C,D) Dorsal and lateral views: 12 hours after the third AF removal, dlx5a was expressed in the re-formed AER (left side). (E-H2) Expression pattern of fgf24 and fgf10a 12 hours after the third AF removal. Fgf24 was expressed in the regenerating AER, and fgf10a was expressed in the distal portion of the endoskeletal region (F,H). Distal is to the left on the control side (E,E2,G,G2) and to the right on the AF removal side (F,F2,H,H2). (I-J3) Distribution of BrdU-positive cells after formation of a new AER. Whereas there are BrdU-positive cells at the distal edge of the endoskeletal region in the control side of the fin (I), in the side in which the AF had been removed, BrdU-positive cells are mainly located in the re-formed AER/AF region (white brackets) and in the endoskeletal region (J). Distal is to the right on the control side (I-I3) and to the left side on the AF removal side (J-J3). Blue dots indicate the fin margin. Scale bars: 100 μm in I,J. |