
Fig. 8
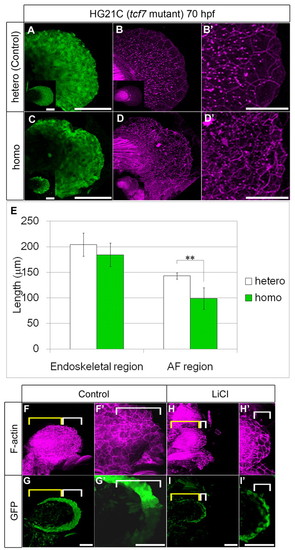
Disruption of cell shape caused AF shrinkage. (A-E) Heterozygotes for control (A,B) and homozygotes (C,D) of tcf7 mutants [HG21C line (Nagayoshi et al., 2008)]. The AF is shortened and wavy with abnormal shrunken cells (C,D). Insets (bottom left in A-D) show images of whole fin and high magnification of the cell shape is shown in B2,D2. (E) PD lengths of the endoskeletal region (left) and AF region (right) at 70 hpf in heterozygotes (n=12) and homozygotes (n=9). Measurements are shown in supplementary material Table S4. Data were analyzed by Student’s t-test (**P<0.001). Error bars indicate s.d. (F-I2) LiCl treatment. Cytoskeletal disruption of the AF was detected by immunostaining for F-actin (magenta) using the hspGFFDMC131A;UAS:GFP fish (green). About five rows of ectodermal cells (white brackets) were located in the control fin (0.3 M NaCl) (F,G, high magnification of the AF in F2,G2). The LiCl-treated fin had the same number of ectodermal rows as the control, but the cells were flattened along the PD axis (H,I, magnification of the AF in H2,I2). Note that the endoskeletal region (yellow brackets) was hardly affected in this experiment. Scale bars: 100 μm in A,C,F-I2 50 μm in B2,D2. |