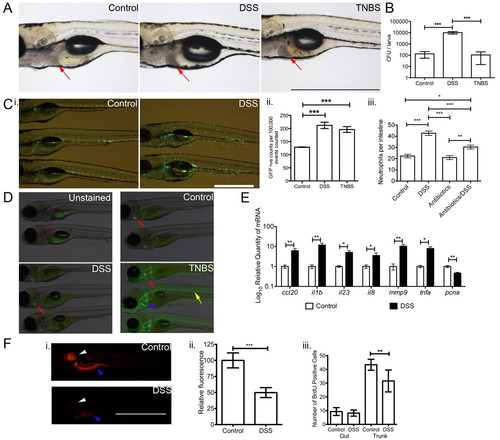
DSS exposure causes a distinct enterocolitis in zebrafish larvae when compared with TNBS exposure. (A) Whole-mount live imaging of control, DSS-and TNBS-exposed larvae. Red arrows indicate liver. (B) Comparison of recovered microbiota from homogenates of control, DSS- and TNBS-exposed larvae (n=7). (C) Characterization of neutrophilic inflammation in zebrafish larvae by: (i) live imaging of Tg(mpx:EGFP)i114 larvae; (ii) enumeration of neutrophils by FACS (n=5); and (iii) enumeration of intestinal neutrophils (n≥30 per group; three biological replicates). (D) Comparison of DAF-FM-DA staining in wild-type larvae treated as indicated. Red arrow indicates heart, blue arrow indicates cleithrum and yellow arrow indicates notochord. (E) Quantitative PCR analysis of pro-inflammatory cytokine and proliferating cell nuclear antigen gene expression in untreated and DSS-treated 6 dpf larvae (n=4). (F) Characterization of cellular proliferation in zebrafish larvae by: (i) live imaging of resazurin-stained larvae; (ii) quantification of fluorescence from live imaging (n=19); and (iii) manual counting of BrdU-positive cells in the gut and trunk (n=7). White arrowhead indicates otic vesicle and blue arrowhead indicates intestine in live images. Error bars indicate s.e.m.; ***P<0.0001, **P<0.01 and *P<0.05 as determined by ANOVA (B,C) or Student’s t-tests (E,F). Scale bars: 1 mm.
|
