
FIGURE
Fig. 4
- ID
- ZDB-FIG-120405-75
- Publication
- Behra et al., 2012 - Transcriptional signature of accessory cells in the lateral line, using the Tnk1bp1:EGFP transgenic zebrafish line
- Other Figures
- All Figure Page
- Back to All Figure Page
Fig. 4
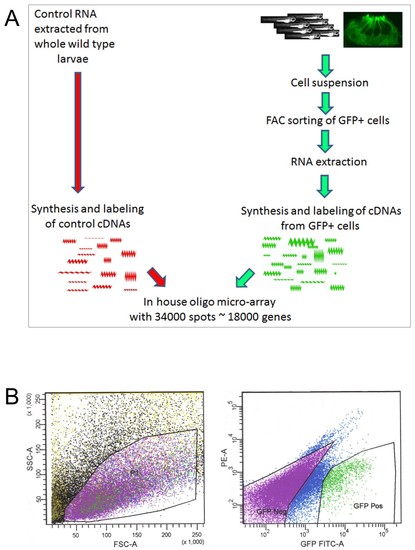
Strategy to establish the transcriptional profile of accessory cells combining FACS and microarrays. A. Schematic of the experimental procedures. B. illustration of the gating used for the FACS. The left plot (showing the P1 gate) was used to sort cells according to cell size (forward scatter, FSC-A) vs. granularity (side scatter, SSC-A). The right plot discriminated cells according to GFP fluorescence intensity (GFP FITC-A) vs. Phycoerythrin (PE-A). Gates were selected as shown to sort GFP negative (GFP Neg) and GPP positive (GFP Pos) cells. |
Expression Data
Expression Detail
Antibody Labeling
Phenotype Data
Phenotype Detail
Acknowledgments
This image is the copyrighted work of the attributed author or publisher, and
ZFIN has permission only to display this image to its users.
Additional permissions should be obtained from the applicable author or publisher of the image.
Full text @ BMC Dev. Biol.