
FIGURE
Fig. 3
- ID
- ZDB-FIG-111216-4
- Publication
- Lister et al., 2011 - Embryonic expression of zebrafish MiT family genes tfe3b, tfeb, and tfec
- Other Figures
- All Figure Page
- Back to All Figure Page
Fig. 3
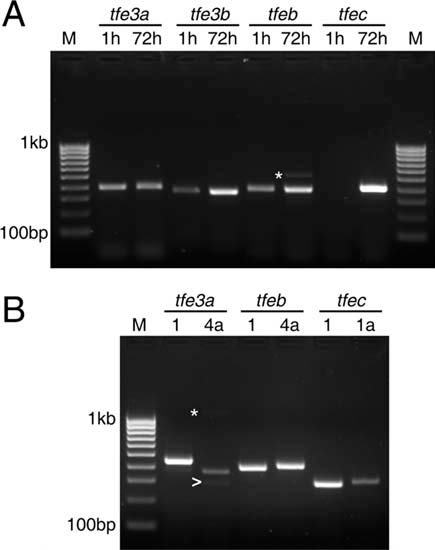
MiT isoforms expressed during embryogenesis. A: Reverse transcriptase-polymerase chain reaction (RT-PCR) demonstrating expression of MiT genes at 1 and 72 hr postfertilization. M, 100 basepair ladder markers. B: RT/PCR with isoform-specific primers at 72 hours postfertilization (hpf). Asterisks indicate nonspecific products; arrow indicates tfe3a transcript lacking exon 6. |
Expression Data
| Genes: | |
|---|---|
| Fish: | |
| Anatomical Term: | |
| Stage Range: | 4-cell to Protruding-mouth |
Expression Detail
Antibody Labeling
Phenotype Data
Phenotype Detail
Acknowledgments
This image is the copyrighted work of the attributed author or publisher, and
ZFIN has permission only to display this image to its users.
Additional permissions should be obtained from the applicable author or publisher of the image.
Full text @ Dev. Dyn.