
Fig. 5
- ID
- ZDB-FIG-110915-13
- Publication
- Zygmunt et al., 2011 - Semaphorin-PlexinD1 Signaling Limits Angiogenic Potential via the VEGF Decoy Receptor sFlt1
- Other Figures
- All Figure Page
- Back to All Figure Page
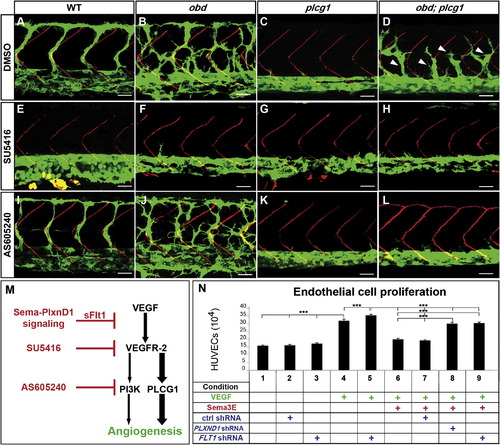
Enhanced VEGF Signaling Causes obd′s Exacerbated SeA Angiogenesis (A–L) Thirty-two hpf trunk vasculatures. WT, obd, plcg1 and obd; plcg1 treated with DMSO, SU5416 (VEGFR inhibitor), or AS605240 (PI3K inhibitor). Genotypes, top; treatments, left. Endothelium, green. SBs, red. White arrowheads, recovered SeA sprouts in obd; plcg1. Anterior, left; dorsal, up. Scale bars represent 30 μm. n = 18 embryos per genotype and treatment. Pictures show representative phenotypes (18/18 embryos per category). (M) Diagram of the VEGF cascade and steps inhibited by sflt1 and drugs used in (E)–(L). (N) HUVEC proliferation in response to combinations of VEGF, Sema3E, and shRNAs (control, PLXND1 and FLT1). ***p < 0.001. Error bars represent SEM. |
| Fish: | |
|---|---|
| Observed In: | |
| Stage: | Prim-15 |
Reprinted from Developmental Cell, 21(2), Zygmunt, T., Gay, C.M., Blondelle, J., Singh, M.K., Flaherty, K.M., Means, P.C., Herwig, L., Krudewig, A., Belting, H.G., Affolter, M., Epstein, J.A., and Torres-Vazquez, J., Semaphorin-PlexinD1 Signaling Limits Angiogenic Potential via the VEGF Decoy Receptor sFlt1, 301-314, Copyright (2011) with permission from Elsevier. Full text @ Dev. Cell