
Fig. 2
- ID
- ZDB-FIG-110915-10
- Publication
- Zygmunt et al., 2011 - Semaphorin-PlexinD1 Signaling Limits Angiogenic Potential via the VEGF Decoy Receptor sFlt1
- Other Figures
- All Figure Page
- Back to All Figure Page
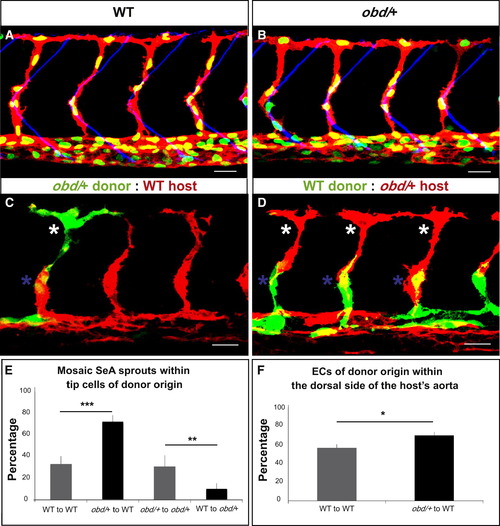
ECs with Less Sema-PlxnD1 Signaling Tend to Become Tip Cells and Occupy the Aorta′s Dorsal Side (A and B) 32 hpf vasculatures. EC nuclei (green), membranes (red). SBs, blue. (A) WT. (B) obd/+. (C and D) 28 hpf vasculatures with ECs of donor (green) and host (red) origin. Asterisks: Tip cells (white), stalk cells (blue). (E) Percentage of mosaic SeAs with tip cells of donor origin in homogenotypic (gray bars) and heterogenotypic (black bars) chimeras. n = 27 WT to obd/+, n = 18 obd/+ to obd/+, n = 38 obd/+ to WT, n = 34 WT to WT. Error bars represent SEM. (F) Percentage of ECs of donor origin found within the dorsal side of the host′s arterial tree in homogenotypic (gray bar) and heterogenotypic (black bar) chimeras. (E and F) *p < 0.05, **p < 0.01, ***p < 0.001. Error bars represent SEM. n = 24 WT to WT, n = 32 obd/+ to WT. (A–D) Anterior, left; dorsal, up. Scale bars represent 30 μm. See Figure S2 and Movie S1. |
Reprinted from Developmental Cell, 21(2), Zygmunt, T., Gay, C.M., Blondelle, J., Singh, M.K., Flaherty, K.M., Means, P.C., Herwig, L., Krudewig, A., Belting, H.G., Affolter, M., Epstein, J.A., and Torres-Vazquez, J., Semaphorin-PlexinD1 Signaling Limits Angiogenic Potential via the VEGF Decoy Receptor sFlt1, 301-314, Copyright (2011) with permission from Elsevier. Full text @ Dev. Cell