
Fig. S3
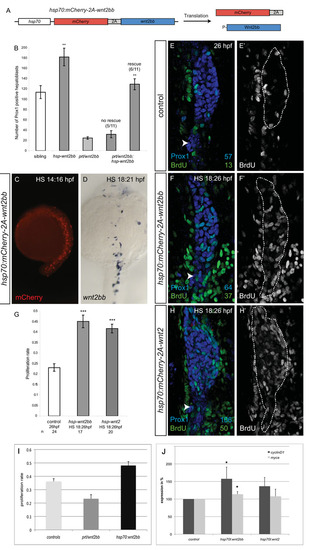
Excess wnt2 or wnt2bb promotes hepatoblast specification and proliferation. (A) The wnt2bb overexpression construct. The hsp70 promoter controls expression of a mCherry-2A-wnt2bb transcript, which upon translation produces independent mCherry and Wnt2bb protein, owing to an unstable bond in the viral 2A-linker peptide. (B) The phenotypic rescue in a subset of prt/wnt2bb embryos transiently overexpressing wnt2bb, determined by hepatic Prox1 expression. (C) Live picture of injected embryo 2 hours after heat-shock. mCherry indicates cells in which the hsp70:mCherry-2A-wnt2bb construct was activated. (D) Whole-mount mRNA in situ hybridization for wnt2bb showing ectopic activation 3 hours after heat-shock. Staining was stopped before endogenous expression was detectable. (E-H2) Cell proliferation rates are increased in embryos in which wnt2bb (F,F2) or wnt2 (H,H2) have been ectopically activated; numbers indicate count of individual Prox1- and BrdU-positive cells. Liver anlage (broken line) is expanded posteriorly in embryos with excess wnt2bb (F,F2) and wnt2 (H,H2) compared with controls (E,E2); inter-renal primordium (arrowhead) serves as landmark. (G) Proliferation rates in controls, hsp70:mCherry-2A-wnt2bb and hsp70:mCherry-2A-wnt2 embryos determined by Prox1 and BrdU labelling. (I) Cell proliferation in the LPM is decreased in prt/wnt2bb embryos at 30 hpf and increased in embryos after its transient activation at 18 hpf; proliferating cells were determined by BrdU and Tg(XlEef1a1:GFP)s854 to exclude the endoderm. (J) cyclinD1 and myca expression 4 hours after transient wnt2bb and wnt2 overexpression at 26 hpf; controls represent siblings exposed to the same heat-shock regime to determine the effect specific to Wnt overexpression. (C) Lateral view, (D) dorsal view, (E-H2) ventral views of projections of confocal stacks; all anterior towards the top. (B,G,I,J) Standard errors and P values are shown (*Pd0.05; **P<0.001; ***P<2.10-8). |