
Fig. S1
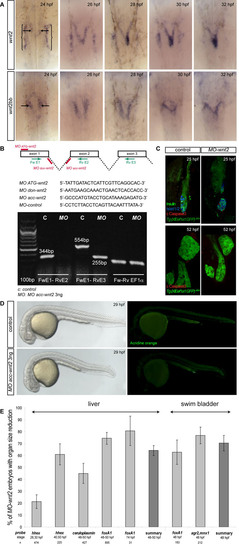
Validation of MO-wnt2. (A) wnt2 and wnt2bb mRNA expression between 24 and 32 hpf. Brackets indicate the prospective pronephros and arrows indicate wnt2 and wnt2bb expression in the LPM. wnt2 domains differ from wnt2bb expression in that they are located in more medial and posterior regions of the mesoderm. (B) The wnt2 knock-down strategy; sequences of the relevant MOs are shown. RT-PCR analysis MO acc-wnt2 embryos show a complete knock-down of Wnt2, as indicated by a loss of exon2; sequences of indicated PCR-primers are: Fw E1, 52-CGTAGACAAGTGCCTGAACG-32 Rv E2, 52-CAGGAGCCTCCCGAACAG-32 and Rv E3, 52-GACCTGGGTGAACTTGATGG-32. (C) MO-wnt-2 embryos display no apparent cell death in the foregut endoderm at 25 and 52 hpf, revealed by staining for cleaved caspase 3 in Tg(XlEef1a1:GFP)s854 embryos. Islet1/2, insulin-positive dorsal pancreas serves as landmark. (D) Likewise, Acridine Orange staining shows no overall increase of cell death at 29 hpf in MO-wnt2 embryos. (E) Quantification of whole-mount mRNA expression analyses reveals 64% of MO-wnt2 embryos show a hypoplastic liver and 70% a hypoplastic swim bladder; standard errors are indicated; n, number of embryos. (A) Dorsal views, (C) 27 hpf and 52 hpf, single confocal section of ventral view; all anterior towards the top. (D) Lateral views, anterior towards the left. |