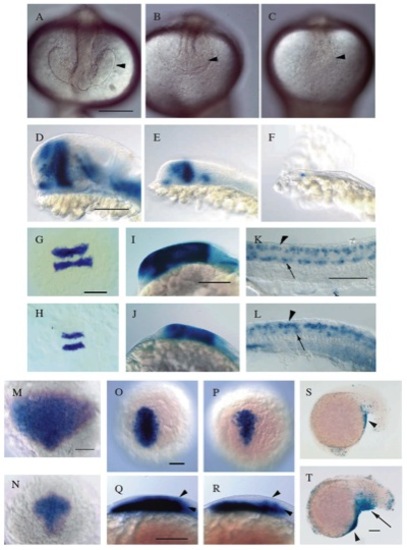
(A-F) CNS phenotype of crm alleles. Anterior nervous system of (A) WT, (B)crmb305 and (C) crmb409 diploid embryos [20 somite stage]. Note the reduced size of the optic vesicles (arrowheads) in crmb305 and their absence in crmb409 homozygotes. Expression in (D) WT, (E) crmb305 and (F) crmb409 of lim5 [24 hours]. (A-C) Frontal views, with dorsal to the top; (D-F) side views, with anterior to the left. (G-L) Polarity is retained in crm mutant CNS. (G) WT and (H) crmb305 mutant krox-20 expression at 4-6 somites. (I) WT and (J) crmb305 mutant otx1 expression at 20 somites. (K) WT and (L) crmc4 mutant isl1 expression in trunk spinal cord at 24 hours. Dorsal Rohon-Beard sensory neurons (arrowheads) and ventral primary motor neurons (arrows) express isl1 (Korzh, et al., 1993; Inoue, et al., 1994). G and H are dorsal views, with anterior to the top; I-L are side views with anterior to the left. M-R: Markers of neurectoderm are reduced in crm- gastrula. (M) WT and (N) crmc4 mutant expression of otx2 at 80% epiboly. (O, P) Expression of gsc [80% epiboly] in WT (O) and crmc4 mutant (P). (Q,R) Side view of gsc expression at same stage, in WT (Q) and mutant (R). Arrowheads delimit the ectodermal expression, which is decreased in the crm- embryo, while the underlying mesodermal expression is preserved. In M-P, view is dorsal with anterior to the top. (S,T) Increased cell death in crm- embryos. (S) WT and (T) crmc4 mutant at 18 somites, with cell death visualized in situ by terminal transferase labeling of nuclear DNA. Arrowheads indicate cluster of apoptotic cells on posterior yolk, and arrow in (T) indicates apoptotic cells in the ventral mutant tail; however, increased cell death is not found in the CNS or its precursor cells (data not shown). View is from the side, with anterior to the left. Scale bars, 100 μm.
|
