
Fig. 4
- ID
- ZDB-FIG-110221-56
- Publication
- Lau et al., 2011 - Identification of a brain center whose activity discriminates a choice behavior in zebrafish
- Other Figures
- All Figure Page
- Back to All Figure Page
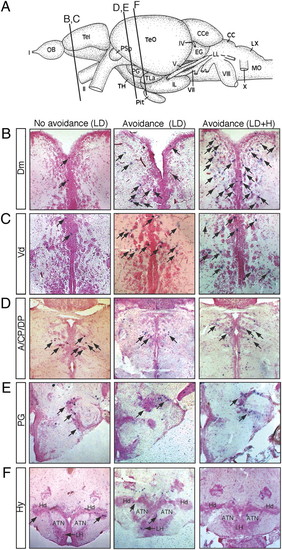
Mapping of c-fos neuronal activity. In all images, c-fos–positive cells are shown in purple (arrows) and brain sections are counterstained with the nuclear fast red. (Left) Brain sections from an animal that was stimulated with the L/D visual stimulus and displayed little avoidance behavior (choice index: -0.04). (Center) Brain sections from an animal that was stimulated with the L/D visual stimulus and displayed avoidance behavior (choice index: 0.40). (Right) Brain sections from animals that were stimulated with the L/D + H and displayed avoidance behavior (choice index: 0.92). (A) Schematic showing the section positions. (B) Dm. (C) Vd. (D) Dorsal thalamus (A, CP, and DP). (E) Preglomerular complex (PG). (F) Hy [anterior tuberal nucleus (ATN), dorsal zone of the periventricular hypothalamus (Hd), and lateral hypothalamic nucleus (LH)]. |