
Fig. 1
- ID
- ZDB-FIG-110221-55
- Publication
- Lau et al., 2011 - Identification of a brain center whose activity discriminates a choice behavior in zebrafish
- Other Figures
- All Figure Page
- Back to All Figure Page
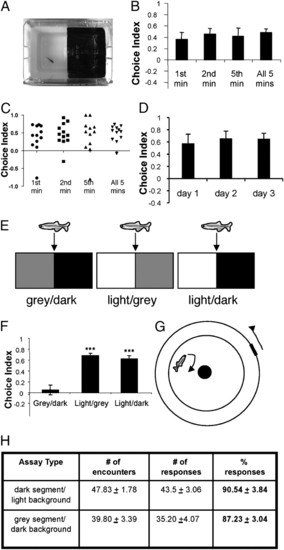
Adult zebrafish display an innate light avoidance behavior. (A) Photograph of the L/D choice chamber. (B) Choice indices in the choice chamber during first, second, fifth, and all 5 min analyzed (a choice index of 1.0 represents 100% time spent on the dark side, and an index of -1.0 represents 100% time spent on the light side) (n = 12 for each group). (C) Scatter plot of B, showing the distribution of choice indices in the tested animals. (D) Choice indices of three trials with a 24-h interval between each trial. The means for choice indices are day 1 (0.58 ± 0.15), day 2 (0.66 ± 0.12), and day 3 (0.65 ± 0.09) (n = 13; P = 0.64, ANOVA followed by the Bonferroni post hoc test). (E) Schemes of different choice chambers. (F) Choice indices in different choice chambers (L/D, n = 26; light/gray, n = 23; gray/dark, n = 24; F = 28.55, ***P < 0.001 compared with gray/dark, Tukey′s test). (G) Scheme of a visual acuity chamber for testing the ability of zebrafish to discriminate between gray and dark. (H) Comparable visual discrimination of gray segment over dark background (n = 6) vs. dark segment over light background (n = 5), as indicated by comparable % responses (F = 0.36, P = 0.56, Tukey′s test). |