FIGURE
Fig. S2
Fig. S2
|
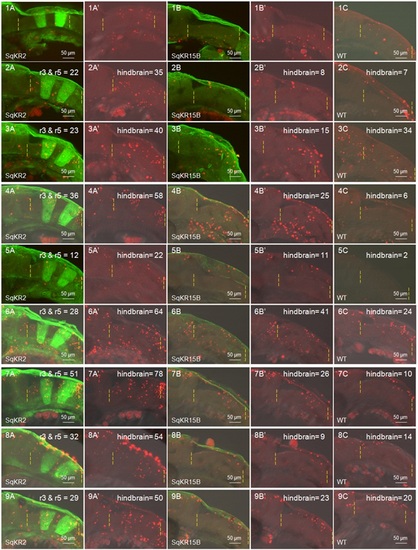
Compilation of TUNEL staining data used to generate the bar chart for apoptosis in the hindbrain. (1-9A) Merged fluorescent/DIC images of KR expressing cells (green) and TUNEL-positive cells (red) in SqKR2 (A), Sq15B (1-9B) and wild type zebrafish embryos (1-9C). TUNEL-positive cells in each data set were quantified using the count tool in Adobe Photoshop CS4. |
Expression Data
Expression Detail
Antibody Labeling
Phenotype Data
Phenotype Detail
Acknowledgments
This image is the copyrighted work of the attributed author or publisher, and
ZFIN has permission only to display this image to its users.
Additional permissions should be obtained from the applicable author or publisher of the image.
Full text @ BMC Dev. Biol.

