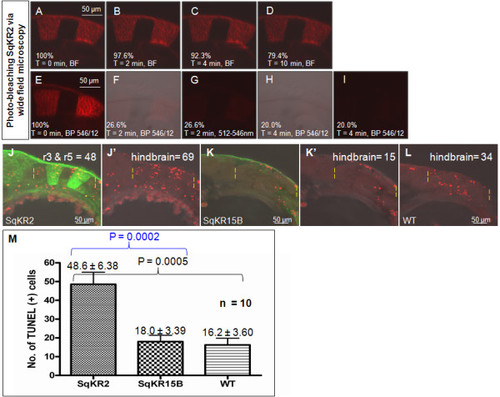
Illumination of the hindbrain of SqKR2 caused bleaching of KR followed by increase in apoptosis. (A-I) Efficient photobleaching of KR was achieved by intense green light using the UV lamp of the compound microscope in widefield mode. (A-C) Fluorescent merged images of the SqKR2 embryo at various time points, before and after illumination with white light. (E-I) Fluorescent merged images of the SqKR2 embryo at various time points, before and after illumination with green light. F and H are the bright field and fluorescent merged images of E and G, respectively. (J-L) Merged fluorescent/DIC images of KR-expressing cells (green) and TUNEL-positive cells (red) in SqKR2 (J), SqKR15B (K) and wild type zebrafish embryos (L). (J, L) Embryos were double stained for TUNEL (red) and (J, K) in addition by anti-KR antibody (green). (M) When compared to illuminated controls apoptosis increased more than two-fold in the hindbrain of illuminated SqKR2. A bar chart documenting the average number of TUNEL-positive cells per embryo in 10 embryos of three illuminated groups (SqKR2, SqKR15B and WT control). Values presented as mean ± SEM. Paired T test between the illuminated SqKR2 embryos and controls showed that the difference in the average number of TUNEL-positive cells is significant (P < 0.05). P values between groups are highlighted by the enclosing brackets.
|
