|
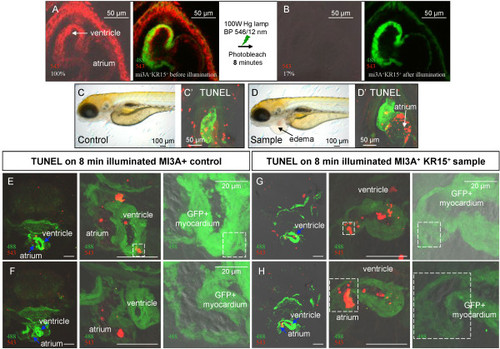
Increased illumination increased apoptosis in the KR-expressing heart. (A-B) 8 min illumination of the 3dpf heart of SqKR15 embryo with intense green light reduced fluorescence intensity to 17%. (A) GFP and SqKR15 fluorescence in the ET33-mi3A:SqKR15 double transgenic embryo before and (B) after illumination. (C-D) same larvae one day after illumination: C - ET33-mi3A (control), D - SqKR15/ET33-mi3A (sample). TUNEL (+) cells in the heart of illuminated sample (D′) and control (C′), a day after illumination. (E-F) TUNEL staining of transverse sections of SqET33-mi3A larva (control) and (G-H) SqKR15/ET33-mi3A larva (sample), at different magnification one day after illumination. Examples of TUNEL (+) cells in the myocardial layer are boxed in white. All scale bars are 50 μm in length unless otherwise stated.
|