
Fig. 2
- ID
- ZDB-FIG-101119-7
- Publication
- Distel et al., 2009 - Optimized Gal4 genetics for permanent gene expression mapping in zebrafish
- Other Figures
- All Figure Page
- Back to All Figure Page
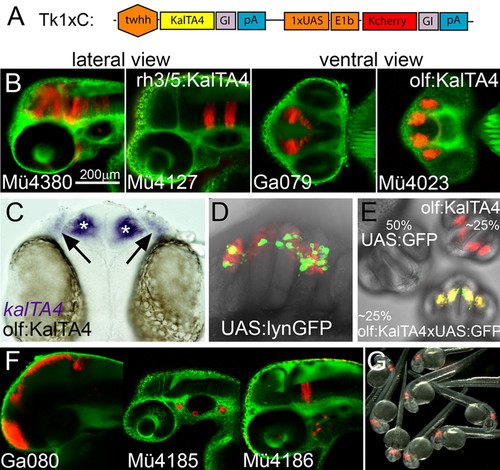
KalTA4GI enhancer trapping. (A) Schematic representation of the TK1xC enhancer trapping construct. (B) Examples of transgenic Gal4 enhancer trap lines at 50 hpf (C) kalTA4 mRNA expression (asterisk: olfactory bulb, arrow olfactory epithelium) in line olf:KalTA4. (D) Transactivation of lynGFP in Ulyn (10) injected olf:KalTA4 embryo. (E) KalTA4-mediated transactivation of GFP expression in offspring (26 hpf) from crosses of heterozygous olf:KalTA4 and 4xUAS-KGFPGI carriers. (F) Different expression patterns in F1 embryos (50 hpf, lateral view) derived from the same P0 founder fish. (G) Offspring of a rh3/5:KalTA4 homozygous carrier crossed to a wild-type fish. Note that all embryos display the characteristic mCherry fluorescence in rhombomeres 3 and 5. Embryos in B and F are counterstained with green Bodipy Ceramide. |