
Fig. S2
- ID
- ZDB-FIG-101119-11
- Publication
- Distel et al., 2009 - Optimized Gal4 genetics for permanent gene expression mapping in zebrafish
- Other Figures
- All Figure Page
- Back to All Figure Page
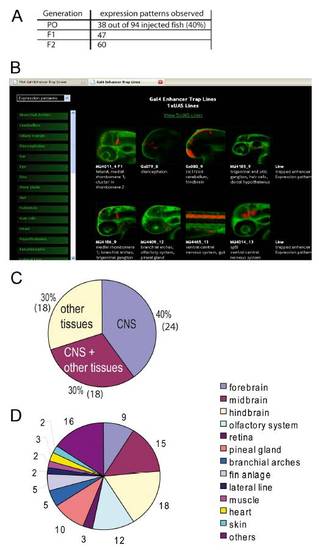
Analysis of isolated zebrafish KalTA4 enhancer trap strains. (A) Numbers of independent transgenic founders in the P0, F1, and F2 generation of the KalTA4 enhancer trap screen. (B) Screenshot of searchable database in which images of different expression patterns from many strains are displayed. In addition, sequences of the respective Gal4-activator and UAS effector vectors as well as a protocol for nested inverse PCR to determine the integration sites of the enhancer trap vector in different lines can be found at: http://www.helmholtz-muenchen.de/en/idg/groups/neuroimaging/lines_distel/. (C>) Distribution of expression patterns in the isolated tissue specific KalTA4 enhancer trap lines of the F2 generation. (D) Distribution of all observed expression patterns throughout the isolated KalTA4 strains of the F2 generation. Note that many lines show mCherry expression in several tissues. Distel |