
Fig. 1
- ID
- ZDB-FIG-101119-6
- Publication
- Distel et al., 2009 - Optimized Gal4 genetics for permanent gene expression mapping in zebrafish
- Other Figures
- All Figure Page
- Back to All Figure Page
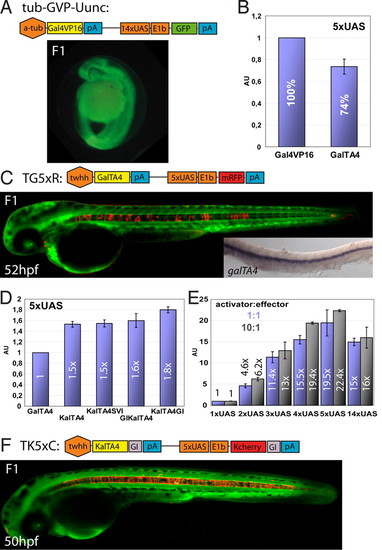
Optimization of the Gal4 system in zebrafish. (A) Schematic representation of construct tub-GVP-Uunc (10) and transgenic F1 zebrafish embryos. (B) Comparison of Gal4VP16 (set as 100%) and GalTA4 activity in luciferase assays (n = 3, Pac2 fibroblasts) using a 5xUAS:luciferase construct. (C) Schematic representation of the TG5xR construct and transgenic F1 embryo. Inset: mRNA in situ hybridization of GalTA4 expression throughout the notochord. (D) Activation potentials of differently modified Gal4 activators as determined by luciferase assays (n = 3). The activity of GalTA4 was set as 1. (E) Effects of different numbers of Gal4 DNA binding sites using pCSKalTA4GI and UAS-luciferase constructs (ratio 1:1 blue columns or 10:1 black columns) in luciferase assays (n = 3, 1xUAS:luciferase set as 1). (F) Schematic representation of the TK5xC construct and transgenic F1 embryo. Data are presented as mean ± SEM. Embryos in C and F are counterstained with green Bodipy Ceramide. |