
FIGURE
Fig. S10
- ID
- ZDB-FIG-101025-38
- Publication
- Bajoghli et al., 2009 - Evolution of genetic networks underlying the emergence of thymopoiesis in vertebrates
- Other Figures
- All Figure Page
- Back to All Figure Page
Fig. S10
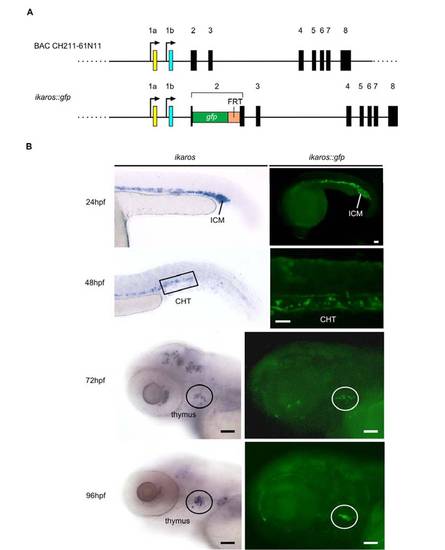
Characterization of the ikaros::gfp zebrafish transgenic line. |
Expression Data
| Genes: | |
|---|---|
| Fish: | |
| Anatomical Terms: | |
| Stage Range: | Prim-5 to Day 4 |
Expression Detail
Antibody Labeling
Phenotype Data
Phenotype Detail
Acknowledgments
This image is the copyrighted work of the attributed author or publisher, and
ZFIN has permission only to display this image to its users.
Additional permissions should be obtained from the applicable author or publisher of the image.
Reprinted from Cell, 138(1), Bajoghli, B., Aghaallaei, N., Hess, I., Rode, I., Netuschil, N., Tay, B.H., Venkatesh, B., Yu, J.K., Kaltenbach, S.L., Holland, N.D., Diekhoff, D., Happe, C., Schorpp, M., and Boehm, T., Evolution of genetic networks underlying the emergence of thymopoiesis in vertebrates, 186-197, Copyright (2009) with permission from Elsevier. Full text @ Cell