
Fig. 4
- ID
- ZDB-FIG-101025-35
- Publication
- Bajoghli et al., 2009 - Evolution of genetic networks underlying the emergence of thymopoiesis in vertebrates
- Other Figures
- All Figure Page
- Back to All Figure Page
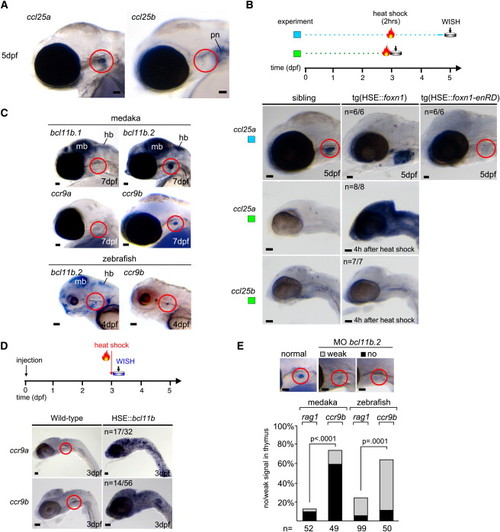
Characterization of foxn1/ccl25 and bcl11b/ccr9 Networks (A and B) The gene encoding the ccl25a chemokine is a down-stream target of foxn1. (A) Whole-mount RNA in situ hybridization indicates that only ccl25a, and not ccl25b, is expressed in the thymus (red circle) of medaka embryos. pn, pronephros. The gene encoding the chemokine ccl19 is not expressed in the thymus (data not shown). (B) Induction of wild-type foxn1 (HSE::foxn1) or dominant-negative foxn1 (HSE::foxn1-enRD) in transgenic lines augments ccl25a expression in the thymus (red circle) or abolishes it, respectively. The number of embryos with the indicated expression patterns is shown. Note that ccl25b expression is unaffected by foxn1 (bottom panel). (C–E) The transcription factor bcl11b participates in the regulation of expression of the ccr9 chemokine receptor. (C) Only one of the bcl11b homologs of medaka and zebrafish is expressed in the thymus as detected by whole-mount RNA in situ hybridization (bcl11a.1 and bcl11a.2 are not expressed in the thymus; data not shown); both homologs of ccr9 are expressed, but ccr9b shows stronger expression in the thymus (see Figure S5). bcl11b genes are coexpressed in the midbrain (mb) and hindbrain (hb). (D) Transient misexpression of Bcl11b results in overexpression of ccr9. Mouse Bcl11b cDNA was cloned into the heat-shock vector shown in Figure 2B. The number of embryos with the indicated expression patterns is shown; position of the thymus is marked by red circle. (E) Knockdown of bcl11b.2 selectively abolishes ccr9 expression in the thymus, while only mildly affecting rag1 expression (morpholino concentration was 800 μM for medaka and 500 μM for zebrafish embryos); in embryos injected with a control morpholino, rag1 expression levels are normal (data not shown; see also Figure 5C). Examples of expression patterns and their classification in medaka embryos are shown at the top. The position of the thymus is highlighted in red. Scale bars represent 50 μm. |
| Genes: | |
|---|---|
| Fish: | |
| Knockdown Reagent: | |
| Anatomical Terms: | |
| Stage: | Day 4 |
Reprinted from Cell, 138(1), Bajoghli, B., Aghaallaei, N., Hess, I., Rode, I., Netuschil, N., Tay, B.H., Venkatesh, B., Yu, J.K., Kaltenbach, S.L., Holland, N.D., Diekhoff, D., Happe, C., Schorpp, M., and Boehm, T., Evolution of genetic networks underlying the emergence of thymopoiesis in vertebrates, 186-197, Copyright (2009) with permission from Elsevier. Full text @ Cell