
Fig. 8
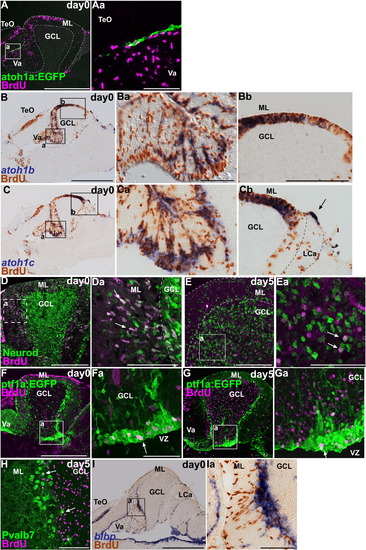
Expression of proneural genes associates with cell proliferation in the adult cerebellum. (A–D) BrdU incorporation in atoh1a, atoh1b, atoh1c, or Neurod-expressing cells. Adult (about 3 months old) Tg(atoh1a:EGFP) or wild-type fish were labeled with BrdU for 1 h, and proliferating cells were analyzed by immunostaining with anti-BrdU antibody (magenta in A; brown in B and C), and anti-EGFP (green, A), anti-Neurod (green, D) antibodies, or atoh1b (purple, B) or atoh1c (purple, C) probes. Parasagittal (A) and sagittal sections near the midline (B–D). (Aa, Ba, Bb, Ca, Cb, and Da) High-magnification views of the boxes in (A–D). (E) Birthdate analysis of granule cells. Adult fish were labeled with BrdU and fixed 5 days after labeling (day 5). The cerebellum was stained with anti-BrdU (magenta) and Neurod (green) antibodies. Sagittal section. (Ea) High-magnification view of the box in (E). BrdU+, Neurod+ granule cells were detected in the molecular layer 1 h after labeling (arrows, Da), but were in the GCL at day 5 (arrows, Ea). (F) BrdU incorporation in ptf1a-expressing cells. Sagittal section (F) and high magnification view (Fa). BrdU+, ptf1a:EGFP+ cells were detected in the VZ (arrow). (G, H) Birthdate analyses of GABAergic lineage. Adult Tg(ptf1a:EGFP) (G) or wild-type (H) fish were labeled with BrdU, and the cerebellum was stained with anti-EGFP (G) or anti-Pvalb7 (H) antibodies on day 5. Sagittal sections (G, H) and high-magnification view (Ga). Many of the BrdU-positive cells stayed in the VZ (arrow, Ga), but BrdU+, Pvalb7+ Purkinje cells were detected (arrows, H) on day 5. (I) BrdU incorporation in blbp-expressing Bergmann glia. Sagittal section through the Va and the rostral CCe (I) and high-magnification view (Ia). Note that blbp signals overlap with the BrdU signals. The abbreviations are defined in [Fig. 1] and [Fig. 3]. Scale bars: 50 μm (Aa, Ea), 100 μm (Ba, Da, E, Ia), 200 μm (D, Fa, H), 500 μm (A, Ba, F), 1 mm (B, I). |
| Genes: | |
|---|---|
| Fish: | |
| Anatomical Terms: | |
| Stage: | Adult |
Reprinted from Developmental Biology, 343(1-2), Kani, S., Bae, Y.K., Shimizu, T., Tanabe, K., Satou, C., Parsons, M.J., Scott, E., Higashijima, S.I., and Hibi, M., Proneural gene-linked neurogenesis in zebrafish cerebellum, 1-17, Copyright (2010) with permission from Elsevier. Full text @ Dev. Biol.