
FIGURE
Fig. S1
- ID
- ZDB-FIG-100525-37
- Publication
- Okuda et al., 2010 - B1 SOX coordinate cell specification with patterning and morphogenesis in the early zebrafish embryo
- Other Figures
- All Figure Page
- Back to All Figure Page
Fig. S1
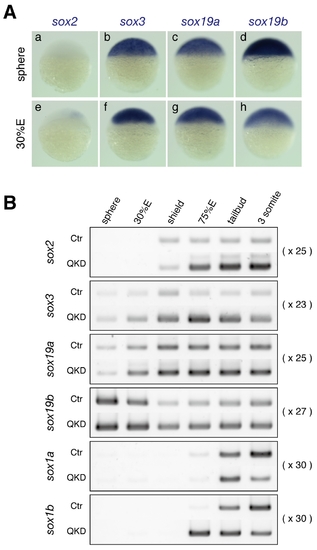
Expression of group B1 sox genes in zebrafish embryos. (A) Expression of the sox2, sox3, sox19a and sox19b genes in zebrafish embryos at the sphere and 30%E stages, visualized by whole-mount in situ hybridization. (B) Expression profiles of the B1 sox genes in uninjected control (Ctr) and QKD embryos from the sphere to 3-somite stages determined by RT-PCR. The amplification cycles used are indicated on the right. bactin1 was used as an RT-PCR control and is shown in Figure 4C. |
Expression Data
Expression Detail
Antibody Labeling
Phenotype Data
Phenotype Detail
Acknowledgments
This image is the copyrighted work of the attributed author or publisher, and
ZFIN has permission only to display this image to its users.
Additional permissions should be obtained from the applicable author or publisher of the image.
Full text @ PLoS Genet.