
Fig. 4
- ID
- ZDB-FIG-100506-52
- Publication
- Ung et al., 2010 - Mercury-induced hepatotoxicity in zebrafish: in vivo mechanistic insights from transcriptome analysis, phenotype anchoring and targeted gene expression validation
- Other Figures
- All Figure Page
- Back to All Figure Page
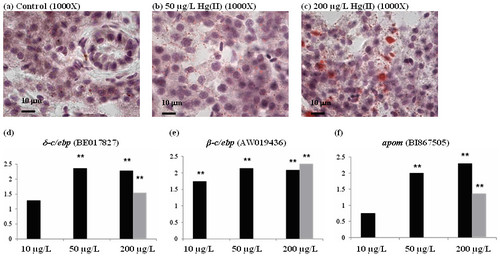
Fatty acid accumulation in zebrafish liver upon mercury exposure. (a-c) Oil red O staining for lipid content in control (a) and HgCl2-treated livers (b-c). Lipid content in the hepatocyte was stained and indicated by red staining showing increased of lipid content in liver of mercury-treated zebrafish is concentration-dependent (b-c). (e, f) Quantitative real-time PCR for mRNAs of adipogenesis genes δ-c/ebp (d), β-c/ebp (e) and apom (f). Results from Real-time PCR indicate level of induced gene expression in these genes are dependent to the concentration of HgCl2 and are sensitive to low concentration of HgCl2 at 10 μg/L. Light grey bar indicate data from microarray (** p-value < 0.05). |