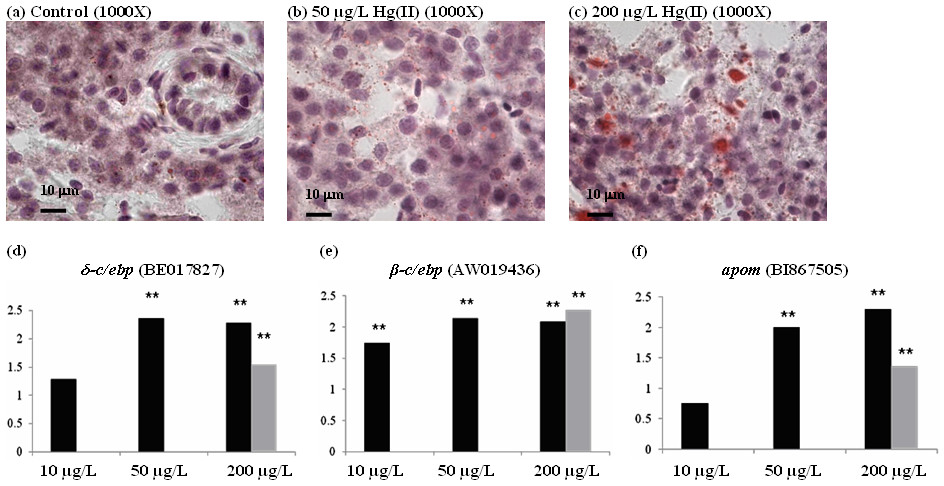
Fig. 4 Fatty acid accumulation in zebrafish liver upon mercury exposure. (a-c) Oil red O staining for lipid content in control (a) and HgCl2-treated livers (b-c). Lipid content in the hepatocyte was stained and indicated by red staining showing increased of lipid content in liver of mercury-treated zebrafish is concentration-dependent (b-c). (e, f) Quantitative real-time PCR for mRNAs of adipogenesis genes δ-c/ebp (d), β-c/ebp (e) and apom (f). Results from Real-time PCR indicate level of induced gene expression in these genes are dependent to the concentration of HgCl2 and are sensitive to low concentration of HgCl2 at 10 μg/L. Light grey bar indicate data from microarray (** p-value < 0.05).
Image
Figure Caption
Acknowledgments
This image is the copyrighted work of the attributed author or publisher, and
ZFIN has permission only to display this image to its users.
Additional permissions should be obtained from the applicable author or publisher of the image.
Full text @ BMC Genomics

