
- Title
-
Mercury-induced hepatotoxicity in zebrafish: in vivo mechanistic insights from transcriptome analysis, phenotype anchoring and targeted gene expression validation
- Authors
- Ung, C.Y., Lam, S.H., Hlaing, M.M., Winata, C.L., Korzh, S., Mathavan, S., and Gong, Z.
- Source
- Full text @ BMC Genomics
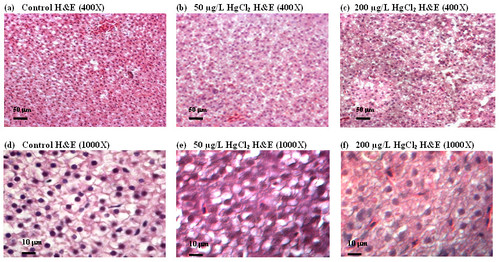
Hematoxylin and eosin (H&E) staining of liver sections from zebrafish treated with mercury. Adult zebrafish were treated with 0 (control, a and b), 50 mg/L (b and e) and 200 mg/L HgCl2 (c and f). Panels (a-c) are shown in low magnification (400x) while (d-f) in high magnification (1000x). HgCl2-treated livers show less compact, homogeneous distribution, more dissociated, irregular in shape and lack of delineated polygonal shape of hepatic parenchyma cells as compared to the controls. |
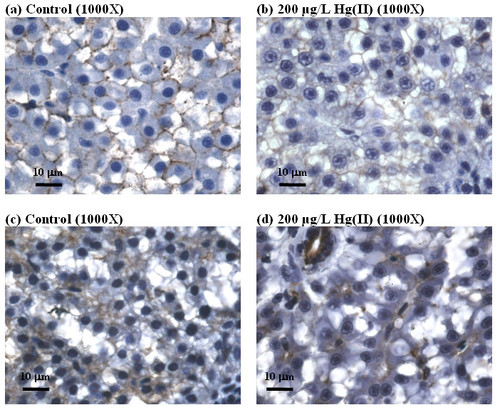
Comparison of hepatic histopathological changes in cell-cell adhesion in control liver (a, c) and induced by HgCl2 (b and d). (a) and (b) show immunohistochemical staining for E. cadherin (indicated by dark brown precipitates). (c) and (d) show immunohistochemical staining for cytokeratin (indicated by dark brown precipitates). |
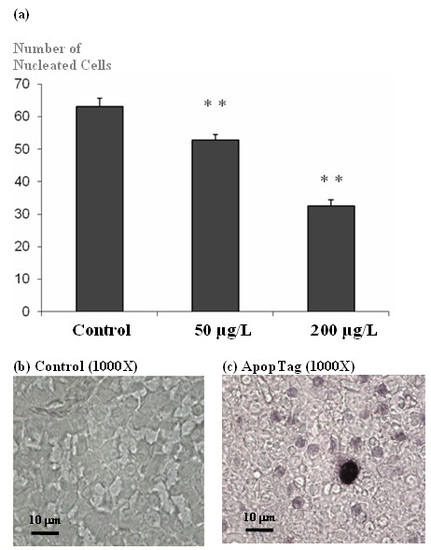
Liver damage induced by HgCl2. (a) Quantitative histological examinations of nucleated-hepatocyte cell count based on H&E stained sections for HgCl2 treated fish was observed to significantly decrease in concentration-dependent manner (** p value < 0.05) compared to the controls. (b) and (c) Apoptag staining for apoptosis-induced DNA damage in hepatocytes in control (b) and HgCl.-treated zebrafish liver (c). |
Fatty acid accumulation in zebrafish liver upon mercury exposure. (a-c) Oil red O staining for lipid content in control (a) and HgCl2-treated livers (b-c). Lipid content in the hepatocyte was stained and indicated by red staining showing increased of lipid content in liver of mercury-treated zebrafish is concentration-dependent (b-c). (e, f) Quantitative real-time PCR for mRNAs of adipogenesis genes δ-c/ebp (d), β-c/ebp (e) and apom (f). Results from Real-time PCR indicate level of induced gene expression in these genes are dependent to the concentration of HgCl2 and are sensitive to low concentration of HgCl2 at 10 μg/L. Light grey bar indicate data from microarray (** p-value < 0.05). |
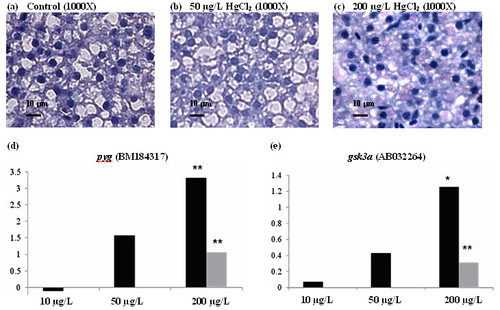
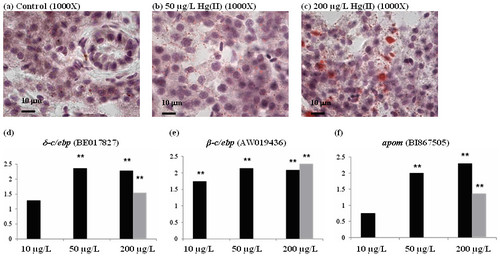
Glycogen accumulation in zebrafish upon mercury exposure. (a-c) Periodic acid Schiff staining (PAS) for glycogen content in control (a) and HgCl2-treated livers (b-c). Glycogen content in the hepatocyte was stained and indicated by pink staining. The increased of glycogen content in the liver of mercury-treated fish is concentration-dependent. (d and e) Quantitative real-time PCR for glycogen phosphorylase (pyg) and glycogen synthase kinase 3a (gsk3a) that involve in gluconeogenesis, respectively. Results from real-time PCR indicate induced gene expression in these genes are dependent to concentration of HgCl2. Light grey bar indicate data from microarray (* p-value < 0.1; ** p-value < 0.05). |
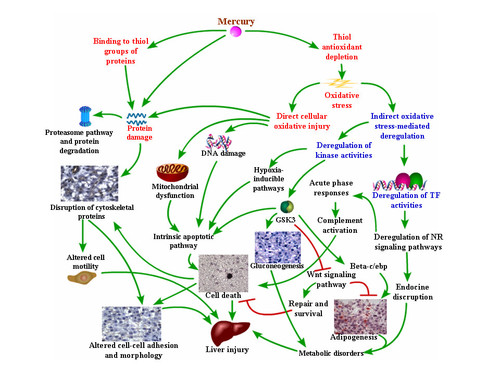
Proposed in vivo hepatotoxicity mechanism in zebrafish upon mercury exposure. The model is proposed based on our transcriptome analysis, phenotype anchoring and targeted gene validation. Words in red and blue fonts are direct and indirect upstream processes induced by mercury, respectively. Black words are downstream processes that are induced or suppressed by either direct or indirect effects of mercury. Please see text for detail description of the indicated mechanism. |