
Fig. 5
- ID
- ZDB-FIG-100506-53
- Publication
- Ung et al., 2010 - Mercury-induced hepatotoxicity in zebrafish: in vivo mechanistic insights from transcriptome analysis, phenotype anchoring and targeted gene expression validation
- Other Figures
- All Figure Page
- Back to All Figure Page
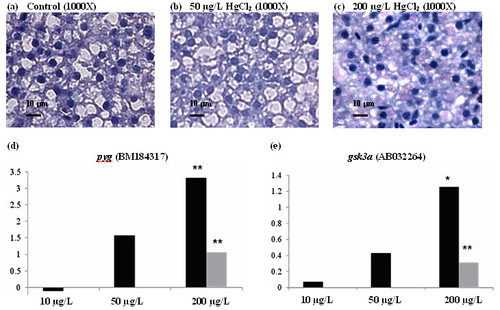
Glycogen accumulation in zebrafish upon mercury exposure. (a-c) Periodic acid Schiff staining (PAS) for glycogen content in control (a) and HgCl2-treated livers (b-c). Glycogen content in the hepatocyte was stained and indicated by pink staining. The increased of glycogen content in the liver of mercury-treated fish is concentration-dependent. (d and e) Quantitative real-time PCR for glycogen phosphorylase (pyg) and glycogen synthase kinase 3a (gsk3a) that involve in gluconeogenesis, respectively. Results from real-time PCR indicate induced gene expression in these genes are dependent to concentration of HgCl2. Light grey bar indicate data from microarray (* p-value < 0.1; ** p-value < 0.05). |