|
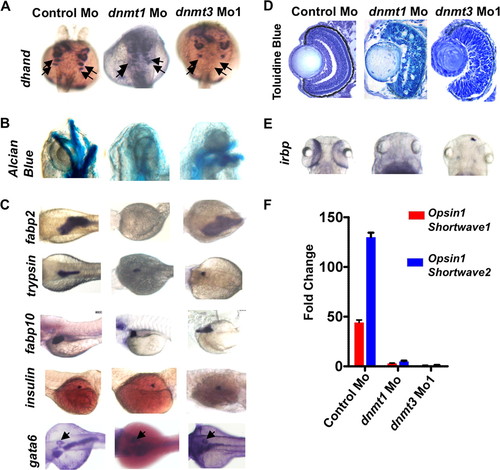
Distinct tissue-specific developmental defects in dnmt1 and dnmt3 morphants. A, C, and E, whole mount in situ analysis of dhand (at 48 hpf) (A), fabp2, trypsin, fabp10, insulin, and trypsin (C), and irbp (E) (all at 96 hpf) in dnmt1, dnmt3, and control morphants. In panel A, arrows show loss of last two pharyngeal pouches in dnmt3 morphants. In panel C, arrows point to expression of gata6 in the pancreas. B, Alcian Blue staining of Control, dnmt1, or dnmt3 morphants at 96 hpf shows loss of jaw structure in dnmt1 morphants but not in dnmt3 morphants. D, toluidine blue staining of histological cross-sections within the dnmt3 morphant retinas at 80 hpf. Note the loss of organization of different retinal layers in dnmt3 morphants. F, quantitative RT-PCR for Opsin Shortwave 1 and Opsin Shortwave 2 in control, dnmt1, or dnmt3 morpholino-injected embryos at 96 hpf.
|