
Fig. 1
- ID
- ZDB-FIG-090817-45
- Publication
- Curran et al., 2009 - Foxd3 Controls Melanophore Specification in the Zebrafish Neural Crest by Regulation of Mitf
- Other Figures
- All Figure Page
- Back to All Figure Page
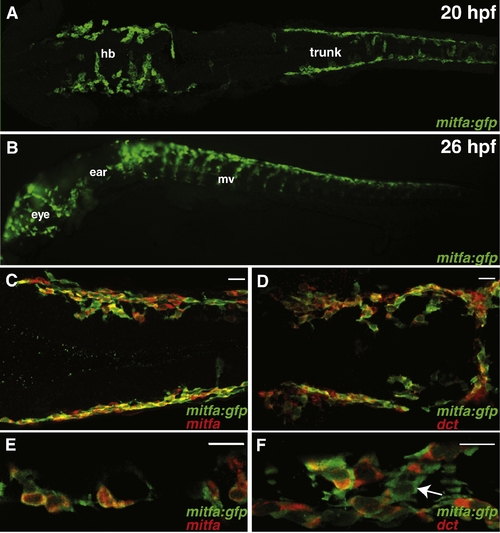
mitfa:gfp transgenic reports mitfa positive melanoblasts. (A) Live GFP expression from 20 hpf mitfa:gfp transgenic zebrafish, streams of migratory neural crest cells arise from lateral stripes, dorsal view, anterior left, 10x. hb = hindbrain. (B) Live GFP expression from 26 hpf mitfa:gfp transgenic zebrafish, mitfa positive neural crest cells migrate ventrally (mv), lateral view, anterior left, 10x. (C, E) mitfa:gfp transgenic recapitulates mitfa expression, dorsal view, anterior left, 24 hpf. Green: GFP expression, red: mitfa mRNA. (C) 20x scale bar = 20 μm. (E) 40x scale bar = 10 μm. 98.4% of mitfa:gfp cells (n = 311) are mitfa positive. (D, F) mitfa:gfp transgenic labels early melanoblasts, dorsal view, anterior left, 24 hpf. Green: GFP expression, Red: dct. (D) 20x. Scale bar = 20 μm. (F) 40x. Scale bar = 10 μm. Arrow points to mitfa:gfp positive cell that has yet to activate dct expression. 55% of mitfa:gfp positive cells (n = 193) are dct positive. |
| Genes: | |
|---|---|
| Fish: | |
| Anatomical Terms: | |
| Stage Range: | 20-25 somites to Prim-5 |
Reprinted from Developmental Biology, 332(2), Curran, K., Raible, D.W., and Lister, J.A., Foxd3 Controls Melanophore Specification in the Zebrafish Neural Crest by Regulation of Mitf, 408-417, Copyright (2009) with permission from Elsevier. Full text @ Dev. Biol.