
Fig. 1
- ID
- ZDB-FIG-081219-35
- Publication
- Berndt et al., 2008 - Rho-kinase and myosin II affect dynamic neural crest cell behaviors during epithelial to mesenchymal transition in vivo
- Other Figures
- All Figure Page
- Back to All Figure Page
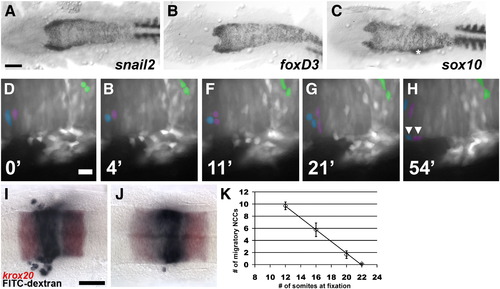
NCCs arise from the neuroepithelium. (A–C) In situ hybridization for myoD and snail2 (A), foxD3 (B), and sox10 (C) at the 8 somite stage, 13 hpf. Asterisk indicates gene expression in the otocyst in C. (D–H) Epifluorescent images from a time-lapse sequence of a Tg(foxD3:gfp) embryo at the 15 somite stage, 16.5 hpf, showing half the neuroepithelium in the region of rhombomeres 5 and 6. Dividing cells and their daughters are pseudocolored. Arrowheads in H indicate daughters of two divisions that migrate to the edge of the neuroepithelium. Time is in minutes. (I–J) Examples of embryos fixed at the 12 somite stage (I) and the 20 somite stage (J) after photo-uncaging of FITC-dextran 2 h earlier in rhombomere 4. Embryo is labeled for uncaged FITC (purple) and krox20 (red). K) Plot of the number of migratory NCCs at various ages 2 h post uncaging. All are dorsal views, anterior left. Scale bar = 100 μm for A–C; 20 μm for D–H; and 40 μm for I, J. |
| Genes: | |
|---|---|
| Fish: | |
| Anatomical Terms: | |
| Stage Range: | 5-9 somites to 14-19 somites |
Reprinted from Developmental Biology, 324(2), Berndt, J.D., Clay, M.R., Langenberg, T., and Halloran, M.C., Rho-kinase and myosin II affect dynamic neural crest cell behaviors during epithelial to mesenchymal transition in vivo, 236-244, Copyright (2008) with permission from Elsevier. Full text @ Dev. Biol.