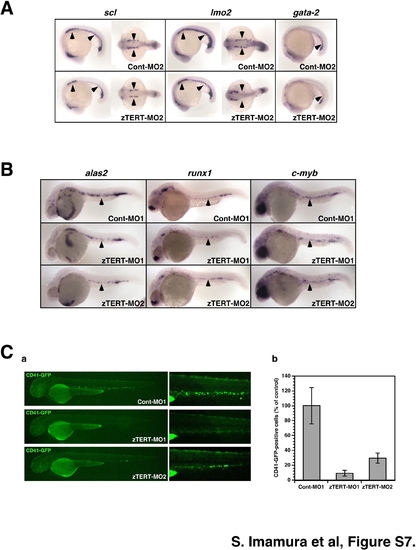
Whole-mount in situ hybridization of in zTERT-MO2-injected embryos.
(A) The detection of primitive hematopoietic markers in embryos at the 20-somite stage (19 hpf) which are oriented with the anterior to the left in lateral (left panels) and dorsal views (right panels). Control (Cont-MO2) and TERT (zTERT-MO2) morphants (8 ng MOs) were analyzed for the expression of scl (zTERT-MO2; n = 51 of 54; 94%), lmo2 (zTERT-MO2; n = 48 of 55; 87%) and gata-2 (zTERT-MO2; n = 50 of 53; 94%), which are early hematopoietic markers. The expression of scl and lmo2 in the ICM and that of gata-2 in the blood island is indicated by arrowheads.
(B) Embryos at 28-32 hpf are oriented with the anterior to the left in lateral views. Control (Cont-MO1) and TERT morphants (both zTERT-MO1 and MO2) (8 ng MOs) were analyzed for the expression of multiple hematopoietic cell lineage markers. Representative time points for the expression of alas2 (32 hpf) (zTERT-MO2; n = 51 of 55; 93%), runx1 (32 hpf) (zTERT-MO2; n = 47 of 50; 94%), and c-myb (32 hpf) (zTERT-MO2; n = 46 of 50; 92%) are shown. Gata-1 (28 hpf) (zTERT-MO2; n = 46 of 53; 87%), pu.1 (28 hpf) (zTERT-MO2; n = 44 of 51; 86%), globin bE3 (28 hpf) (zTERT-MO2; n = 48 of 55; 87%), l-plastin (28 hpf) (zTERT-MO2; n = 51 of 58; 88%), mpo (28 hpf) (zTERT-MO2; n = 50 of 56; 89%), and flk1 (28 hpf) (zTERT-MO2; n = 45 of 51; 88%) are not shown but the results of the expression analysis for these genes were found to be consistent between the MO1 and MO2 morphants. The expression of these genes in the arterial region is indicated by arrowheads
(C) Alterations of CD41GFP-positive cells in zTERT morphants. (a) zTERT-MO1 or MO2 was injected into CD41GFP-transgenic fish embryos. In comparison with the control (Cont-MO1), an apparent decrease of CD41GFP-positive cells was observed in zTERT morphants at 54 hpf. Reduction of CD41GFP-positive cells in the CVP are shown in the right panels. This decreased number of CD41GFP-positive cells in zTERT morphants (in both MO1 and MO2) was observed until 72 hpf. (b) Quantification of CD41GFP-positive cells in the CVP areas of control and zTERT morphants at 54 hpf.
|
