
Fig. 1
- ID
- ZDB-FIG-081028-32
- Publication
- Imamura et al., 2008 - A non-canonical function of zebrafish telomerase reverse transcriptase is required for developmental hematopoiesis
- Other Figures
- All Figure Page
- Back to All Figure Page
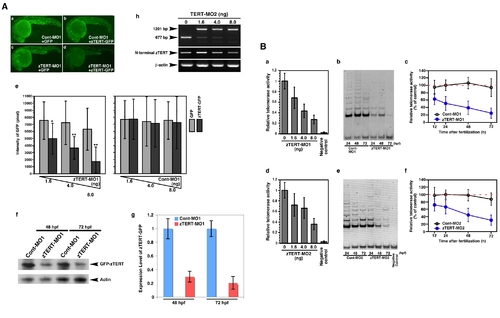
The knockdown of TERT in the zebrafish embryo does not result in telomere shortening. (A) A zTERT-MO1-induced translational block was monitored using mini-zTERT-GFP (zTERT-GFP) in vivo. To test the effectiveness of the MO1 in binding the transcript and inhibiting downstream translation, a GFP reporter construct driven by a DNA sequence upstream from the zTERT coding region (encompassing the zTERT-MO1 target region) was used. Representative GFP expression profiles are shown for embryos (24 hpf) injected with Cont-MO1 and GFP empty vector (a), Cont-MO1 and zTERT-GFP (b), zTERT-MO1 and GFP empty vector (c), and zTERT-MO1 and zTERT-GFP (d). (e) Quantification of the GFP intensity in embryos injected with a combination of MOs (Cont-MO1 or zTERT-MO1) and plasmids (GFP or zTERT-GFP) as shown in Figure 1A. Five independent experiments incorporating more than 50 embryos in each instance were performed. *P<0.01, **P<0.001, (Student t-test). (f) Western blot analysis using an anti-GFP antibody to detect the expression of zTERT-GFP, and its reduction by zTERT-MO1 but not Cont-MO1. (g) For the western blotting results, the intensities of the bands were quantitated using the associated pixel levels and the expression levels of GFP-zTERT were normalized to actin in each time point as a ratio of mean values which are shown in the right side graphs. These experiments were independently performed three times. P<0.001 (Student t-test). (h) RT-PCR analysis of zTERT MO2-induced altered splicing of zTERT transcripts. The 677 bp intact zTERT transcript was detectable in uninjected embryo samples (0 ng), and to some degree in the 1.6 and 4.0 ng injected samples. A 1201 bp product indicating the insertion of an intact intron between exons 5 and 6 was almost predominantly observed in samples injected with 8 ng MO2 (48 hpf). In contrast, the 677 bp intact band was almost undetectable in these same morphants. (B) Quantitative analysis of telomerase activity in zTERT knockdown embryos injected with 1.6 to 8.0 ng MO1 and MO2 during 12–72 hpf. (a, d) A TRAP-ELISA assay was performed in zTERT knockdown embryos injected with 1.6, 4.0, and 8.0 ng MO1 (a) or MO2 (d). (b, e) TRAP assay using electrophoretic gel analysis over a 24–72 hpf timecourse for MO1 (b) or MO2 (d). (c, f) Quantitative fluorometric TRAP assay performed over a 12–72 hpf timecourse for MO1 (c) or MO2 (f). |
| Fish: | |
|---|---|
| Knockdown Reagent: | |
| Observed In: | |
| Stage Range: | Prim-5 to Protruding-mouth |