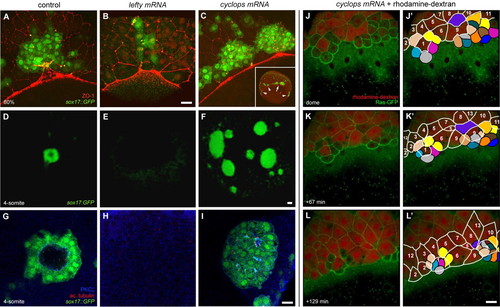
Nodal/TGFβ signalling regulates dorsal forerunner cell formation in a non-cell autonomous manner. (A-C) Confocal images of 75% epiboly Tg(sox17:GFP)-expressing zebrafish embryos immunolabelled with an anti-ZO-1 antibody. z-projections with GFP in green and anti-ZO-1 in red are shown. In a control embryo, DFCs form a compact cluster in contact with the EVL margin (A). A sibling embryo of equivalent age injected with 100 pg of lefty-encoding mRNA shows a markedly reduced number of DFCs (B). By contrast, a sibling embryo injected with 100 pg of cyclops-encoding mRNA shows a clear increase in DFC number (C). A low-magnification image of the same embryo (inset in C) shows the appearance of multiple, widely spaced DFC clusters positioned all along the EVL margin (the main cluster is indicated by an arrow in the inset, additional clusters by arrowheads). (D-I) Confocal images of 4-somite stage Tg(sox17:GFP)-expressing embryos immunolabelled for aPKC-ζ and acetylated tubulin. Vegetal views of 3D-projections of low-magnification images showing GFP in green (D-F) and single focal planes of high-magnification images showing GFP in green, aPKC-ζ in blue and acetylated tubulin in red (G-I). In a control embryo, DFCs form a single, oval-shaped DFC cluster with a ciliated interior lumen (D,G). In a lefty-mRNA-injected embryo of equivalent age, no DFCs are observed (E,H), whereas a cyclops-mRNA-injected embryo displays multiple, abnormally large DFC clusters with significantly smaller, ciliated lumina (F,I). (J-L′) Images from a time-lapse confocal movie of a Tg(β-actin:HRAS-EGFP) embryo co-injected with 50 pg of cyclops mRNA and rhodamine-dextran into a single marginal blastomere at the 64-cell stage. The animal pole is to the top. Three-dimensional projections of the embryo at the dome stage (∼4.2 hpf) and subsequent time points are shown (J-L). Fate mapping of surface epithelial cells shows that ten rhodamine-negative cells and five cells with low rhodamine signal (coloured) become displaced below the EVL margin (J′-L′). By contrast, all cells remaining at the embryonic surface (cells outlined in white and traced by number) are rhodamine-positive. Scale bars: 70 μm in D-F; 20 μm in A-C,G-L′.
|
