
FIGURE
Fig. 1
Fig. 1
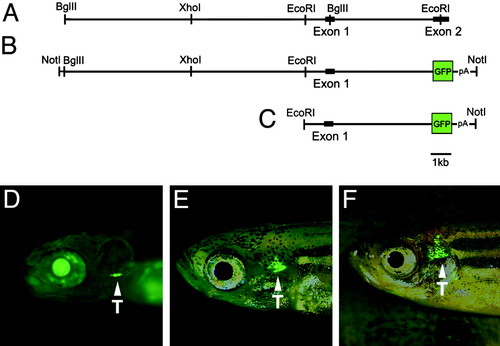
lck-GFP transgenic zebrafish. Diagrams of the genomic DNA sequence comprising the lck promoter (A) and the GFP construct (B) are shown. Enzyme digest sites used for cloning and restriction mapping of the minimal promoter are shown. lck-GFP transgenic fish expressing the 5.5-kb EcoRI-NotI fragment (C) are shown at 8 dpf (D), 45 dpf (E), and 80 dpf (F). Arrowheads denote GFP-labeled cells in the thymus (T). The views are lateral with anterior to the left. |
Expression Data
| Gene: | |
|---|---|
| Fish: | |
| Anatomical Term: | |
| Stage Range: | Days 7-13 to Days 45-89 |
Expression Detail
Antibody Labeling
Phenotype Data
Phenotype Detail
Acknowledgments
This image is the copyrighted work of the attributed author or publisher, and
ZFIN has permission only to display this image to its users.
Additional permissions should be obtained from the applicable author or publisher of the image.
Full text @ Proc. Natl. Acad. Sci. USA