
Fig. 9
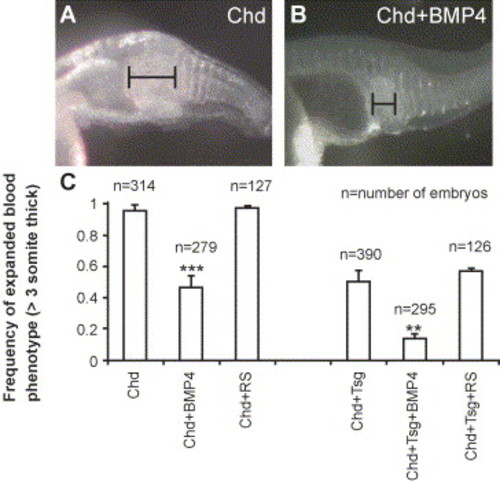
Co-injection of BMP4 MO with chordin MO reduced ICM expansion in chordin morphants. Upper panel: (A–B) ICM expansion in morphant embryos (A) and morphant embryos co-injected with BMP4 MO (B). A width of >3 or d3 somites was arbitrarily defined as the cutoff for ICM expansion. Lower panel: (C) Left: Frequency of ICM expansion in embryos injected with chordin MO (Chd, 0.75 ng), Chd MO (0.75 ng) + BMP4 (12 ng), ChdMO (0.75ng) + random sequence MO (12 ng). Right: Frequency of ICM expansion in embryos injected with ChdMO (0.15 ng) + TsgMO (6 ng), ChdMO (0.15 ng) + TsgMO (6 ng) + BMP4MO (12 ng), ChdMO (0.15 ng) + TsgMO (6 ng) + random sequence MO (12 ng). Each error bar represents 1 SEM. *P < 0.05. RS, random sequence MO (see Materials and methods). |
Reprinted from Developmental Biology, 277(1), Leung, A.Y., Mendenhall, E.M., Kwan, T.T., Liang, R., Eckfeldt, C., Chen, E., Hammerschmidt, M., Grindley, S., Ekker, S.C., and Verfaillie, C.M., Characterization of expanded intermediate cell mass in zebrafish chordin morphant embryos, 235-254, Copyright (2005) with permission from Elsevier. Full text @ Dev. Biol.