
Fig. 4
- ID
- ZDB-FIG-070815-22
- Publication
- Zhao et al., 2007 - Genetic defects of pronephric cilia in zebrafish
- Other Figures
- All Figure Page
- Back to All Figure Page
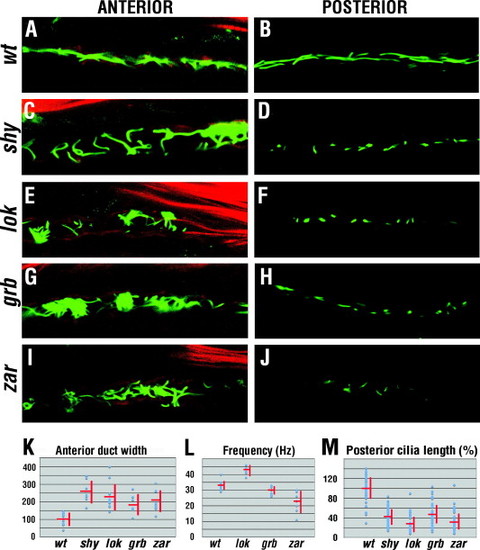
Phenotypes of pronephric cilia. (A, C, E, G, and I) Anterior kidney duct visualized with anti-acetylated tubulin antibody (green) and phalloidin (red) at 30 hpf. Compared to those in the wild type, mutant cilia in this region are misdirected. (B, D, F, H, and J) Posterior pronephric duct cilia visualized by anti-acetylated tubulin antibody (green) at 30 hpf. In mutants, cilia are misdirected and their length is decreased. (K) Dot graph of kidney duct width measurements. (L) Frequency of anterior kidney duct cilia movement. (M) Cilia length in the posterior kidney duct of mutant strains, relative to the wild-type, which is set at 100%. In (A–J), dorsal is up. |
| Fish: | |
|---|---|
| Observed In: | |
| Stage: | Prim-15 |
Reprinted from Mechanisms of Development, 124(7-8), Zhao, C., and Malicki, J., Genetic defects of pronephric cilia in zebrafish, 605-616, Copyright (2007) with permission from Elsevier. Full text @ Mech. Dev.