|
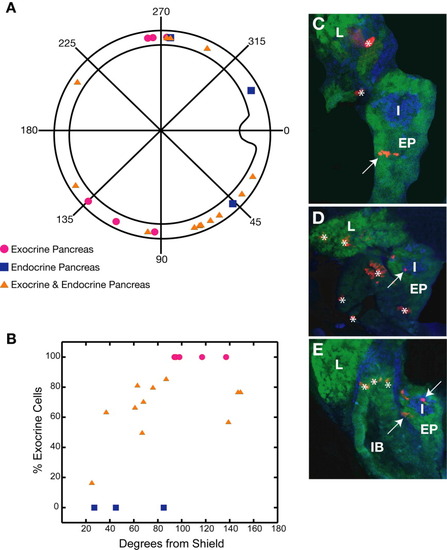
Fate map of the endocrine and exocrine pancreas in zebrafish at 6 hours postfertilization (hpf). A: Polar plot of the locations of endocrine and exocrine pancreatic progenitors at mid-gastrulation. B: Graph of percentage exocrine cells at 72 hpf vs. dorsoventral location of the clone at 6 hpf. The numbers of exocrine and endocrine cells were counted, and the percentage exocrine is the number of exocrine cells divided by the total number of cells. C-E: Confocal slices of representative 72 hpf embryos. C: Embryo with rhodamine dextran-labeled cells in the exocrine pancreas. D: Embryo with labeled cells in the endocrine pancreas. E: Embryo with labeled cells in both the endocrine and exocrine pancreas. Blue cells are islet1 positive. Arrows point to labeled cells that colocalize with the structure of interest. Asterisks (*) point to rhodamine dextran-labeled cells that are not in the pancreas or liver. EP, exocrine pancreas; I, pancreatic islet; IB, intestinal bulb; L, liver.
|