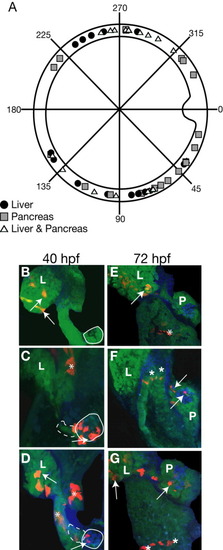
Fate map of liver and pancreatic progenitors at 6 hours postfertilization (hpf). A: Polar plot showing location at 6 hpf of progenitors of the liver and pancreas. The embryos from the 40 hpf and 72 hpf analyses were combined. Gray squares are pancreatic progenitors, black circles are liver progenitors, and white triangles indicate a mixed liver and pancreas population. B-G: All confocal images are individual slices from a Z-stack. B: Embryo with labeled cells in the liver bud at 40 hpf. C: Embryo with labeled cells in the pancreatic bud. D: Embryo with labeled cells in the liver and pancreatic buds at 40 hpf. E: Example of embryo with labeled cells only in the liver at 72 hpf. F: Embryo with labeled cells in the pancreas at 72 hpf. G: Embryo with rhodamine dextran-labeled cells in the liver and the pancreas at 72 hpf. Arrows point to labeled cells that colocalize with the structure of interest. Asterisks (*) point to rhodamine dextran-labeled cells that are not in the pancreas or liver. Dashed lines outline the anteroventral bud and solid lines outline the posterodorsal bud. L, liver; P, pancreas
|
