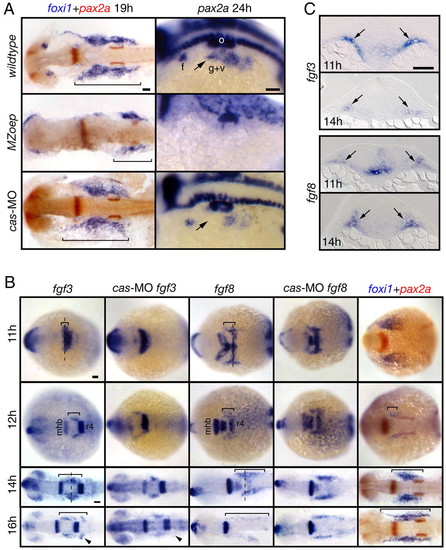
Mesoderm is the likely source of the EB placode-inducing signal(s). (A) MZoep mutants and cas morphants were analyzed for foxi1 and pax2a expression. foxi1 panels show dorsal views, and pax2a panels show lateral views. pax2a expression was absent and foxi1 expression was strongly reduced in MZoep embryos (bracket). In contrast, in cas morphants, foxi1 expression was normal and pax2a expression was slightly reduced (arrow). (B) Wild-type and morphant embryos were collected at 11, 12, 14 and 16 hpf and analyzed for fgf3, fgf8 and foxi1 expression. All panels show dorsal views. The presumptive mesodermal expression of fgf3 and fgf8 is marked by a bracket. Note that these expression domains expand first rostrally and then caudally with time and the expression pattern is largely unchanged in cas morphants, with the exception of a small fgf3-expressing domain (arrowheads). The extent of foxi1 expression (bracket) closely correlates with the extent of fgf3 and fgf8 expression. (C) Transverse sections (level of cross sections indicated by a dashed line in (B) revealed fgf3 and fgf8 expression in the mesoderm underlying ectoderm (arrows). Scale bars: 50 μm. Abbreviations are as in Fig. 1; r4, rhombomere 4.
|
