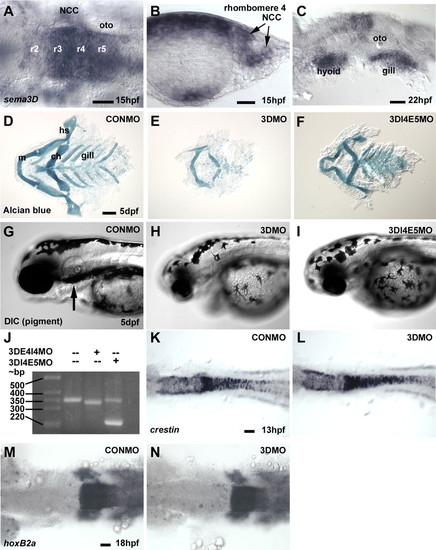
Sema3d mRNA is expressed in NCCs and morpholino knockdown of Sema3d disrupts NCC derivatives without affecting NCC induction. (A-C) In situ hybridization for sema3d at 15 hpf (A,B) and 22 hpf (C). (D-F) Alcian Blue labeling of pharyngeal cartilage at 5 dpf; (G-I) DIC imaging of melanophores in 2 dpf in CONMO (D,G), 3DMO (E,H) and 3DI4E5MO (F,I) injected embryos. Arrow in G indicates ventral horn of melanophores. (J) RT-PCR on mRNA extracted from embryos injected with Sema3d splice blocking morpholinos. (K-N) In situ hybridization for crestin at 13 hpf (K,L) and hoxb2a at 18 hpf (M,N) in CONMO (K,M) and 3DMO (L,N) injected embryos. (A,K-N) Dorsal views, anterior is leftwards. (B) Transverse section through rhombomere 4. (C,G-I) Lateral views, anterior is leftwards. (D-F) Ventral views, anterior is leftwards. r2-r5, rhombomeres 2-5; oto, otocyst; m, hs, ch and gill, Meckel's, hyosymplectic, ceratohyal and gill cartilages, respectively; bp, base pairs. Scale bars: 40 μm for A,C,M,N; 20 μm for B; 100 μm for D-I; 80 μm for K,L.
|
