
Fig. 3
- ID
- ZDB-FIG-060822-1
- Publication
- Hale et al., 2006 - Characterization of the retinoic acid receptor genes raraa, rarab and rarg during zebrafish development
- Other Figures
- All Figure Page
- Back to All Figure Page
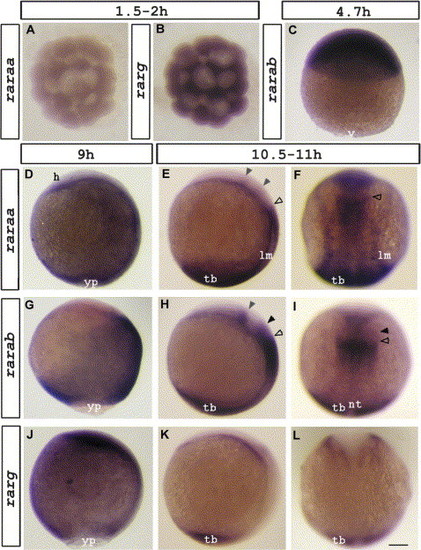
raraa (A, D–F), rarab, (C, G–I), and rarg (B, J–L) expression visualized at 1.5–2 hpf (A, B), 4.7 hpf (C), 9 hpf (D,G,J) and 10.5–11 hpf (E,F,H,I,K,L). Dorsal view (A,B,F,I,L). Lateral view; anterior up and dorsal to the left (D,E,G,H,J,K). (E) Grey arrowheads mark narrow anterior bands. Open black arrowhead marks posterior broad band. (H) Grey arrowhead marks single anterior band. Black arrowhead marks faint broad band. Open black arrowhead marks prominent broad band. Abbreviations: h, presumptive head; lm, lateral mesoderm; nt, notochord; tb, tailbud; v, vegetal pole; yp, yolk plug. Scale bar represents 118 μm in 3A, 3B, 135 μm in 3C, and 121 μm in 3D-L. |
| Genes: | |
|---|---|
| Fish: | |
| Anatomical Terms: | |
| Stage Range: | 16-cell to 1-4 somites |
Reprinted from Gene expression patterns : GEP, 6(5), Hale, L.A., Tallafuss, A., Yan, Y.L., Dudley, L., Eisen, J.S., and Postlethwait, J.H., Characterization of the retinoic acid receptor genes raraa, rarab and rarg during zebrafish development, 546-555, Copyright (2006) with permission from Elsevier. Full text @ Gene Expr. Patterns