
Fig. 4
- ID
- ZDB-FIG-060822-2
- Publication
- Hale et al., 2006 - Characterization of the retinoic acid receptor genes raraa, rarab and rarg during zebrafish development
- Other Figures
- All Figure Page
- Back to All Figure Page
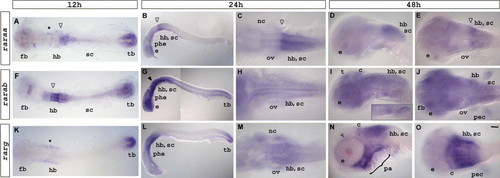
raraa (A–E), rarab (F–J) and rarg (K–O) transcript expression visualized at 12 hpf (A,F,K), 24 hpf (B,C,G,H,L,M) and 48 hpf (D,E,I,J,N,O). Refer to text for detailed descriptions. Flat-mount embryos seen from a dorsal view (A,C,E,F,H,J,K,M,O) or a lateral view (B,D,G,I,L,N). Anterior is to the left. (A) Asterisk marks expression in two stripes lateral to the neural tube. (A–C) Open black arrowhead marks broad stripe of raraa hindbrain expression. (F,G) Open black arrowhead marks broad stripe of rarab hindbrain expression. (I) Inset shows a magnified view of rarab expression in the pharyngeal region. (K) Asterisk marks anterior lateral mesenchyme. (N) Grey arrowhead marks staining around eye. Abbreviations: c, cerebellum; e, eye; fb, forebrain; hb, hindbrain; nc, neural crest; ov, otic vesicle; pec, pectoral fin bud; pa, pharyngeal arches; phe, pharyngeal endoderm; sc, spinal cord; t, tectum; tb, tailbud. Scale bar represents 115 μm in 4A,F,K; 100 μm in 4B,G; 90 μm in 4L; 42 μm in 4C,H; 35 μm in 4D,E,I,J,N,O; 33 μm in 4M. |
| Genes: | |
|---|---|
| Fish: | |
| Anatomical Terms: | |
| Stage Range: | 5-9 somites to Long-pec |
Reprinted from Gene expression patterns : GEP, 6(5), Hale, L.A., Tallafuss, A., Yan, Y.L., Dudley, L., Eisen, J.S., and Postlethwait, J.H., Characterization of the retinoic acid receptor genes raraa, rarab and rarg during zebrafish development, 546-555, Copyright (2006) with permission from Elsevier. Full text @ Gene Expr. Patterns