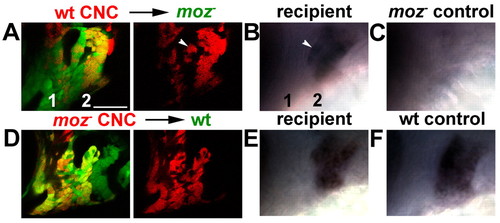
Moz controls hoxb2a expression cell-autonomously in CNC.(A,D) Confocal images at 36 hpf of the first two segments (numbered in A) of fli1:GFP hosts after unilateral transplantation of CNC precursors (red) at shield stage. After live imaging, the same animals were fixed and stained with hoxb2a RNA probe. The transplant recipient sides (B,E) and the contralateral control sides that received no transplant (C,F) are shown. (A-C) Wild-type CNC in a moz-; fli1:GFP host cell-autonomously rescue hoxb2a expression in the second segment. Note the similar zones of red donor and hoxb2a-expressing CNC in A and B; white arrowheads denote a small group of isolated CNC rescued for hoxb2a expression. Second segments of control moz- sides do not express hoxb2a (C). (D-F) moz- CNC in a wild-type fli1:GFP host cell-autonomously fail to express hoxb2a in the second segment. Note the reciprocal zones of red donor and hoxb2a-expressing CNC in D and E. Second segments of control wild-type sides express hoxb2a (F). The similarity of hoxb2a expression in B and E shows that non-hoxb2a-expressing cells preferentially sort to the anterior ventral domain of the second segment. Scale bar: 50 µm.
|
