
Fig. 5
- ID
- ZDB-FIG-060706-10
- Publication
- Crump et al., 2006 - Moz-dependent Hox expression controls segment-specific fate maps of skeletal precursors in the face
- Other Figures
- All Figure Page
- Back to All Figure Page
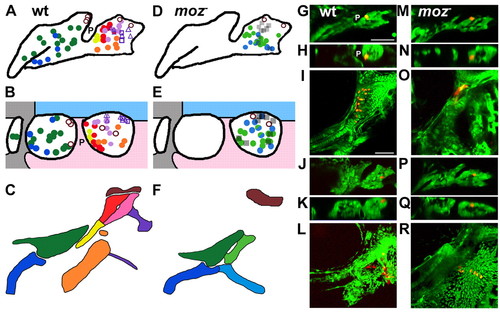
The fate map of second-segment skeletal derivatives is altered in moz mutants. Summaries of wild-type (A-C) and moz- (D-F) fatemaps and representative examples (G-R). Lateral views (A,D,G,J,M,P) and dorsal cross-sectional views at the level of the labelled cell with anterior to the left and lateral up (B,E,H,K,N,Q) are shown at 24 hpf. The facial skeleton is shown at 4 dpf (C,F,I,L,O,R). Filled circles denote facial cartilage precursors, and open circles denote precursors of neurocranial cartilage that surrounds the otic capsule. Triangles and squares denote precursors of the Op (upper) and Br (lower) dermal bones, respectively. moz- CNC that made no skeleton are hatched squares. In B and E, areas of surface ectoderm (blue), endoderm (pink), and stomodeal ectoderm (grey) are shown (compare to insets in Fig. 3A,D). In A,B,G,H, first pouch endoderm (P) is labelled. Wild-type examples of anterior Hm cartilage (G-I) and Op osteocyte (J-L) precursors are shown. (M-R) moz- CNC in similar positions fail to make skeleton. Note that in both wild types and moz mutants the most dorsal CNC in the first and second segment contribute to neurocranial cartilage that surrounds the otic capsule. Scale bars: 50 µm. |